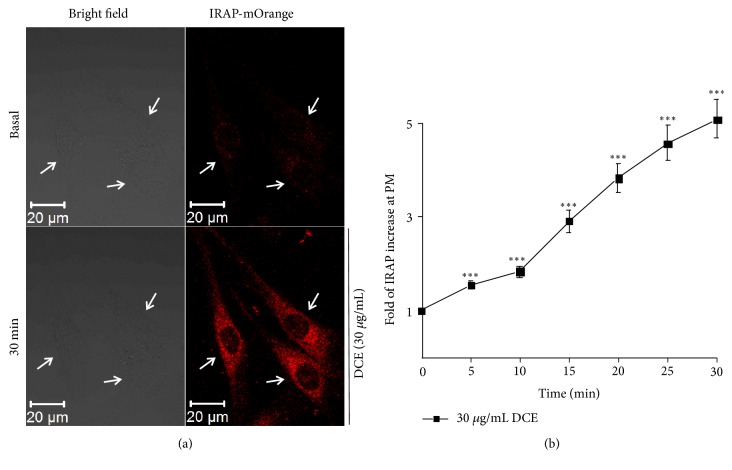
Figure 2.
DCE promoted GLUT4 translocation in L6 cells. (a) The bright field image on the left shows the basic morphology of L6 IRAP-mOrange cells at basal level and 30 minutes after treatment with 30 μg/mL DCE. The images on the right show the significant enhancement of L6 IRAP-mOrange fluorescence intensity after the addition of 30 μg/mL DCE for 30 minutes. (b) Immediately after the addition of 30 μg/mL of DCE until 30 minutes later, the fluorescence intensity of the L6 IRAP-mOrange cell membrane was significantly enhanced. ∗∗∗P < 0.001.

