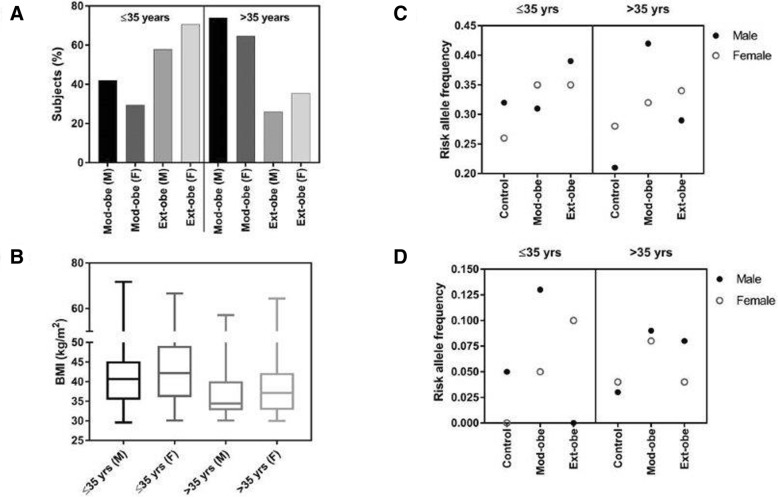
Fig. 2.
Percentage of subjects after subdividing the total patient cohort based on their age, sex and BMI (a); Box plot representing the association of BMI with these subdivided groups (b); Frequency of risk alleles in these subdivided groups: risk allele frequency of rs1800592 (c) and risk allele frequency of rs3811791 (d). Mod-obe (M): moderate-obese male, Mod-obe (F): moderate-obese female, Ext-obe (M): extreme-obese male and Ext-obe (F): extreme-obese female

