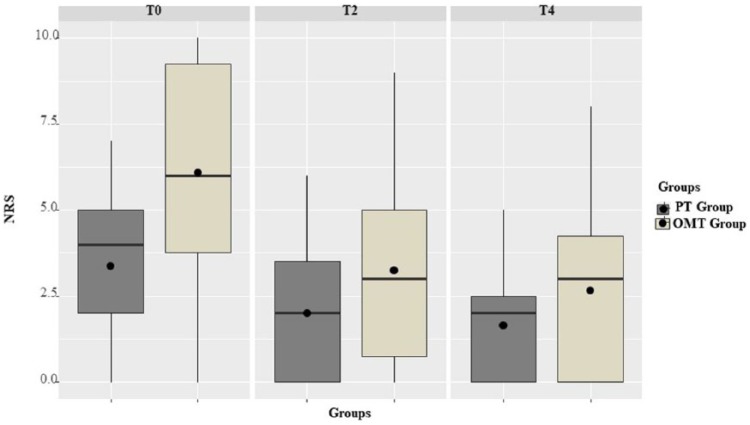
Figure 2.
Box plots of the Numeric Rating Scale (NRS) scores at the T0, T2, and T4. OMT, osteopathic manipulative treatment; PT, physiotherapy.
Whiskers of the plot extends to the minimum and maximum scores. The lower and upper hinges correspond to the first and third quartiles (the 25th and 75th percentiles). Black line inside the hinges corresponds to the median. Black-filled circles correspond to the mean.

