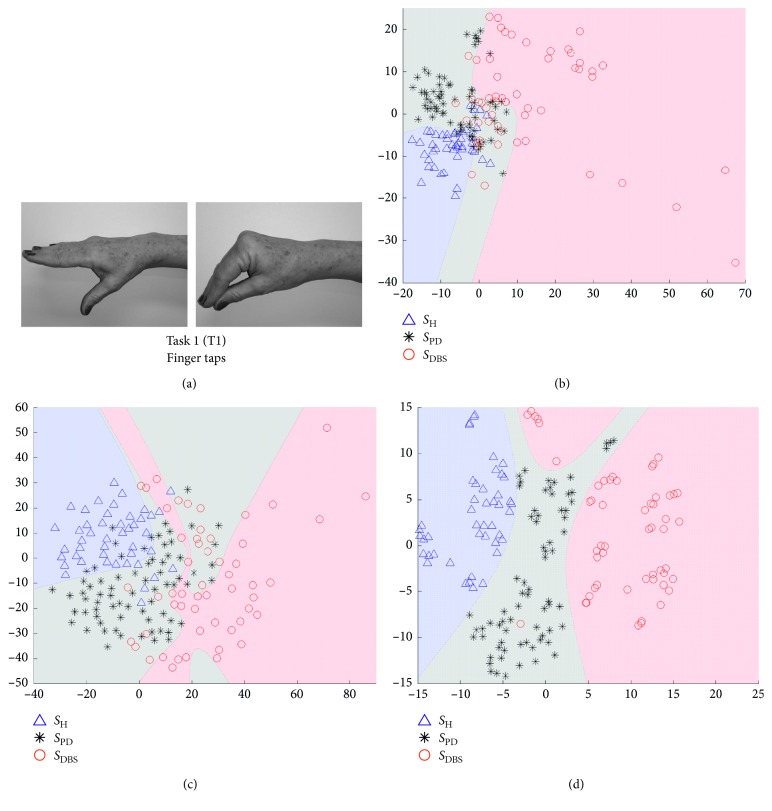
Figure 5.
Visualization of projected data onto a lower dimensional space (step 3 in Figure 3). The visualizations are scatter plots representing dimensionless scores of the projection of high-dimensional feature vectors onto the first (x-axis) against the second (y-axis) estimated components. (a) The data are from Task 1, which is the movement of finger taps. Triangles represent SH, asterisks SPD, and circles SDBS. (b) The projections of PCA technique, (c) projections of Sammon's mapping, and (d) t-SNE map.

