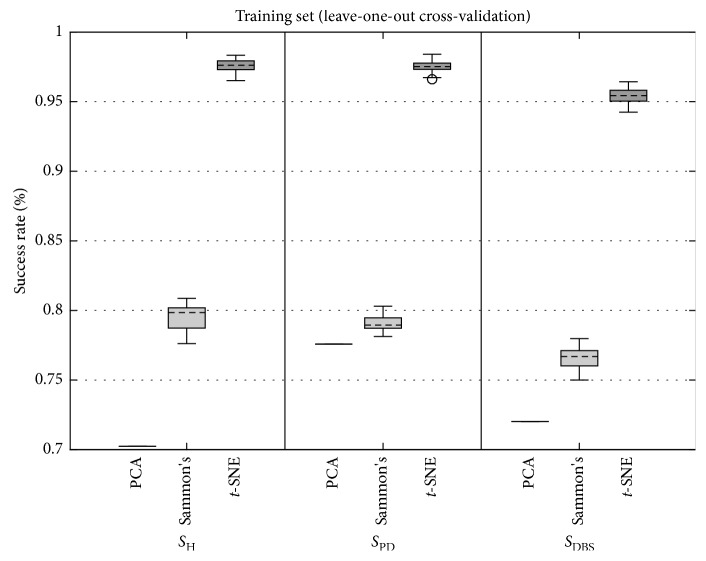
Figure 9.
Boxplots of grand average of true positive success rate achieved by SVM using LOOCV for PCA, Sammon's, and t-SNE DR techniques for participants of SH (left), SPD (center), and SDBS (right) groups. As in this study, PCA has no parameters to be varied (Figure 4); it is depicted by one value, which represents all possible combinations for the PCA DR method.

