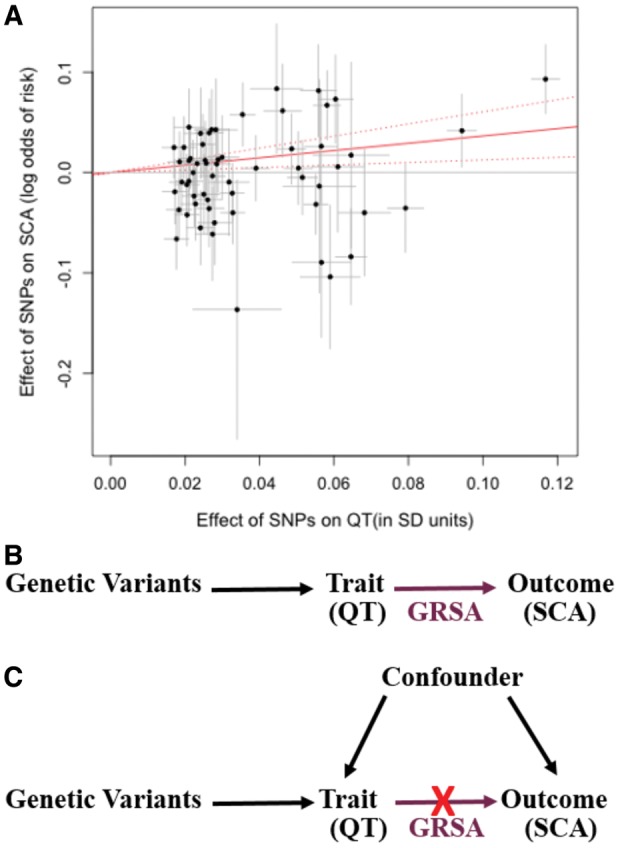
Figure 1.

Genetic Risk Score Association (GRSA) estimation. The plot (A) illustrates the process by which the QT-SCA Genetic Risk Score Association is calculated using SNPs associated with QT at P < 5 × 10⁻⁸. The points represent the effect of each SNP on QT (in units of standard deviation of QT) on the x-axis and the log odds effect on sudden cardiac arrest risk (corresponding 95% confidence intervals in grey) on the y-axis. The estimate of the genetic risk score association is the slope of the zero-intercept weighted regression line (solid red line). For the Genetic Risk Score Association used in our analyses, the model contains a genome-wide LD-pruned SNP set (details in Methods section). The top directed acyclic graph (B) represents a scenario in which the trait of interest has a causal effect on the outcome. If the Genetic Risk Score Association, comprised of trait-associated variants (e.g. QT), has a significant effect on the outcome (e.g. sudden cardiac arrest), it supports a causal role for the trait on the outcome. The bottom directed acyl graph (C) presents the case where an association is observed between the trait and outcome, but the Genetic Risk Score Association comprised of trait-associated variants is not significantly associated with the outcome, suggesting that the observational association is likely being mediated by a confounding variable and the trait does not have a causal impact on the outcome.
