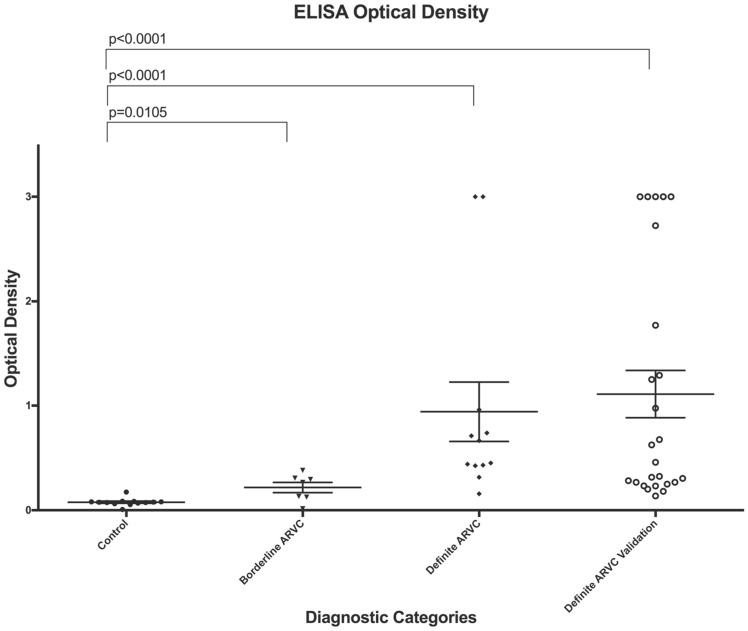
Figure 4.
Dot plot of ELISA optical density for controls, borderline arrhythmogenic right ventricular cardiomyopathy subjects, and definite arrhythmogenic right ventricular cardiomyopathy subjects from our primary and validation cohorts. Error bars represent the mean value of each cohort (mid horizontal line) and standard deviation within each cohort. The two-tailed P-values between the indicated groups are exact values calculated using a Mann–Whitney U-test.

