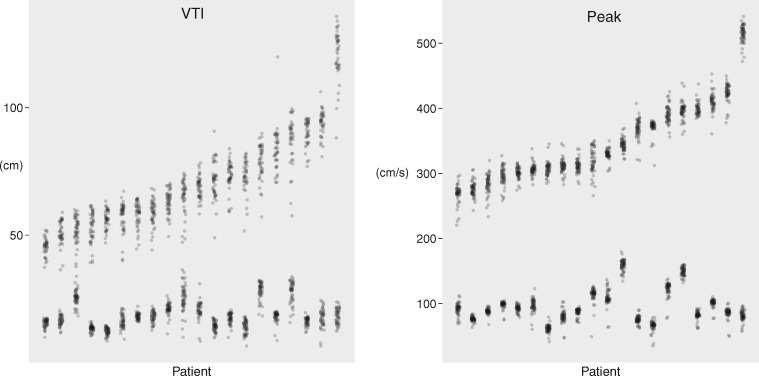
Figure 1.
Variation in VTI (left panel) and peak (right panel) measurements. Each column represents a different case, ordered from the smallest average measurement on the left to largest on the right. Each point represents an operator’s measurement for that case. The upper group are measurements from a CW acquisition through the AV. The lower group are measurements from a pulsed-wave acquisition in the LVOT.

