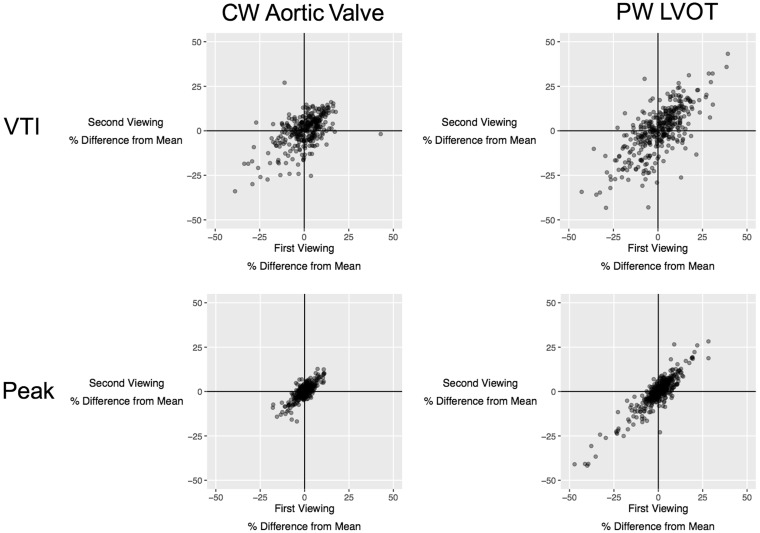
Figure 2.
Consistency in operators’ behaviour when reassessing the same images. Each point represents a measurement made by one operator viewing one case. The position on the horizontal axis represents whether the operator over-read or under-read on the first viewing and scaled to the average of all operators for that case. The position on the vertical axis represents whether the operator over-read or under-read on the second viewing and again scaled to the average of all operators for that case. Operators consistently over-reading on both viewings lie in the top-right quadrant, whereas operators consistently under-reading on both viewings lie in the bottom-left quadrant. The upper panel shows measurements of VTI. The lower panel shows measurements of peak velocity. The left panel shows pulsed-wave LVOT measurements. The right panel showed CW AV measurements.

