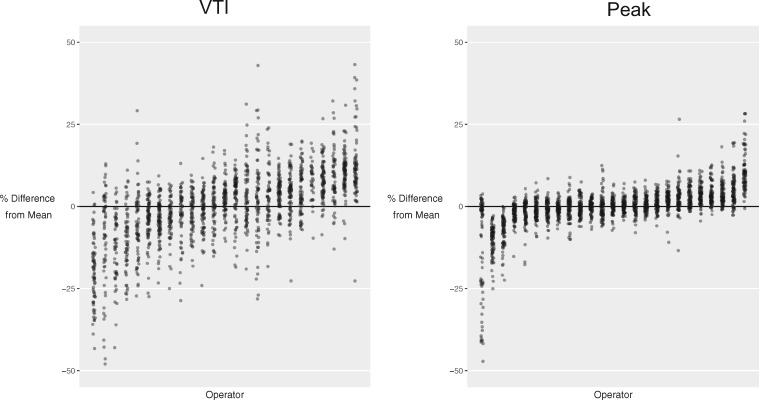
Figure 3.
Tendency of operators to under-read or over-read relative to the average for that case. Each column represents a different operator, ordered from the operator under-reading by the largest proportion on the left to the operator over-reading by the largest proportion on the right. The values have been scaled to the average for that case. The left panel shows VTI measurement. The right panel shows peak measurement.

