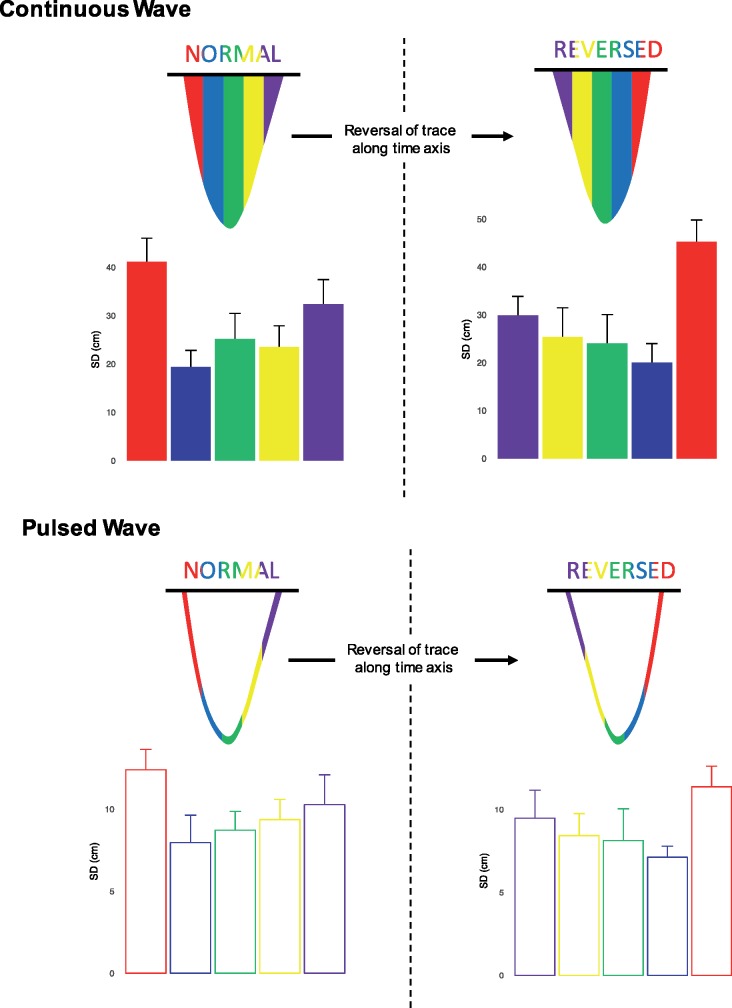
Figure 6.
Variation arising from tracing of continuous wave (upper panels) and pulsed-wave (lower panels) velocity time integral. Each beat is divided into five columns of equal width. The variability is highest in the columns at the beginning and end of the traces. The left panels show the standard deviation for traces presented normally. The right panels show the standard deviation for traces when the horizontal (time) axis is reversed.

