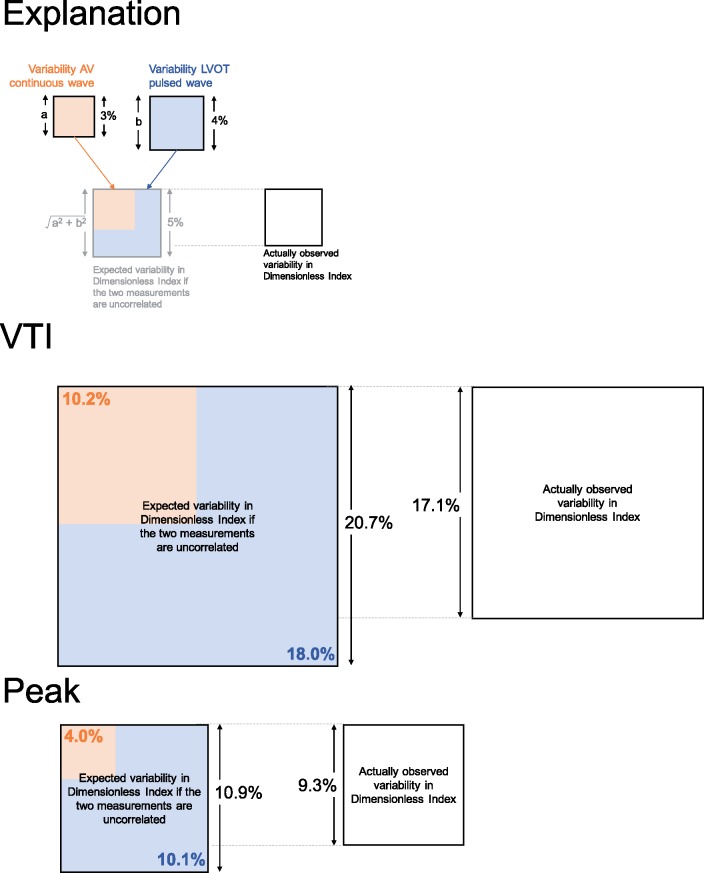
Figure 7.
Expected and observed proportional variance in dimensionless index. The area of the square represents the proportional variance. The orange area is the CW AV variance and the blue area the pulsed-wave LVOT variance. The top panel shows that the expected variance can be calculated from CW and PW variances (combined orange and blue). The actually observed variance (white) indicates the benefit that arises from dimensionless index. The middle panel shows the benefit of dimensionless index in VTI (coefficient of variation 20.7–17.1%). The bottom panel shows the benefit of dimensionless index in peak measurements (coefficient of variation 10.9–9.3%).

