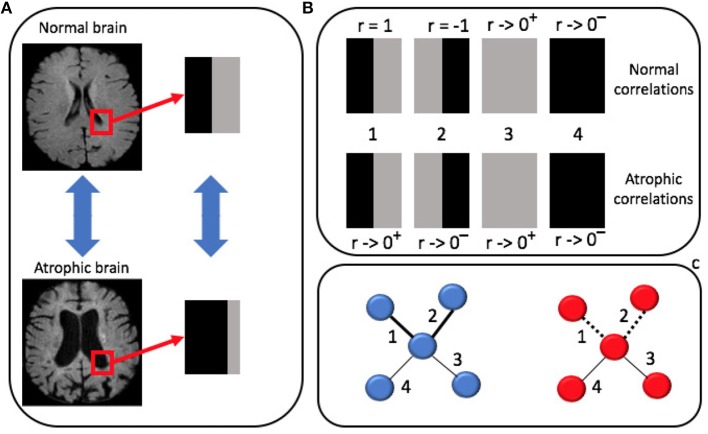
Figure 4.
(A) Brain morphological changes occur in localized regions and affect the spatial distribution of gray level intensities. For example, atrophy increases the cerebrospinal fluid (CSF) volume at the expenses of gray matter (GM) in panel. (B) Pearson's correlation of these two patches is computed against: (1) a patch with a symmetric distribution of GM and CSF; (2) an anti-symmetric patch mimicking left-right inversion; (3) a pure GM patch; (4) a pure CSF patch. (C) In atrophic brains (red) connections (1) and (2) disappear (dotted lines) while they remain strong connections in normal brains (blue).

