Figure 6.

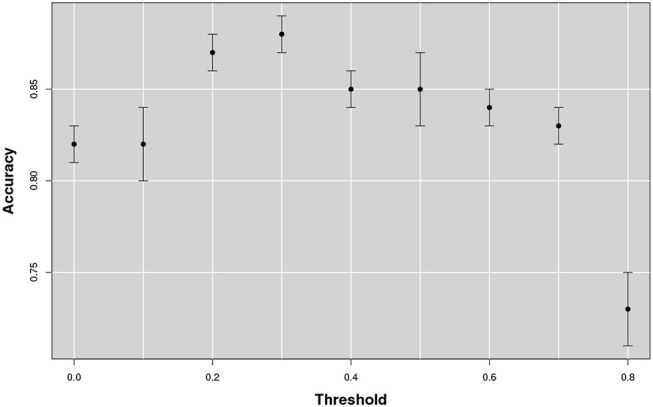
The figure shows the accuracy as a function of the threshold that changes from 0 to 0.8. The best accuracy is obtained in correspondence of a threshold value of 0.3.

The figure shows the accuracy as a function of the threshold that changes from 0 to 0.8. The best accuracy is obtained in correspondence of a threshold value of 0.3.