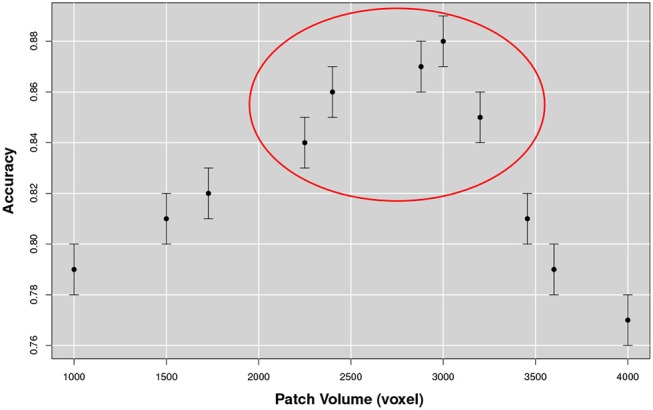
Figure 7.

The figure represents the accuracy for the NC-AD classification as a function of the patch size. The existence of a robust plateau, in correspondence of [2, 250, 3, 200] voxels, is highlighted in the circle. These results suggest the existence of an optimal dimensional scale for multiplex describing AD atrophy patterns.
