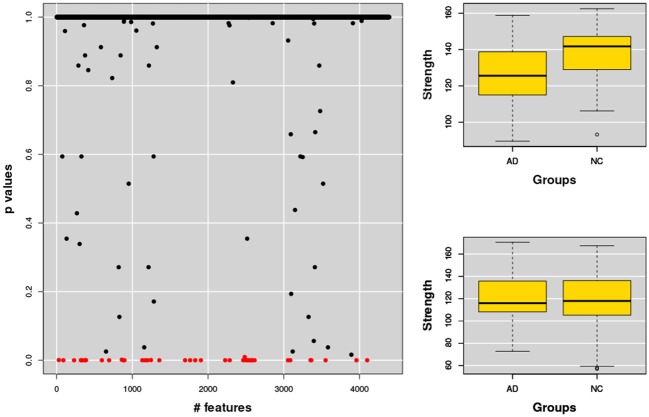
Figure 8.
The figure shows (left) the p-values assigned to each feature, each feature representing a network property, for example the strength of a node. The same analysis was then performed for the related nodes. Typical examples of strength features for nodes significantly correlated (top) or not correlated (bottom) to AD are also shown (right).

