Abstract
Gene expression regulatory mechanisms in models of middle cerebral artery occlusion (MCAO) have been assessed in some studies, but questions remain. The discovery of differentially expressed genes (DEGs) between MCAO and control rats analyzed by next-generation RNA sequencing is of particular interest. These DEGs may help guide the clinical diagnosis of stroke and facilitate selection of the optimal treatment strategy. Twenty rats were equally divided into control and MCAO groups. Three rats from each group were randomly selected for RNA sequencing analysis. Sequence reads were obtained from an Illumina HiSeq2500 platform and mapped onto the rat reference genome RN6 using Hisat2. We identified 1,007 significantly DEGs with p<0.05, including 785 upregulated (fold change [FC]>2) and 222 downregulated (FC<0.5) DEGs, in brain tissue from MCAO rats compared with that from control rats, and numerous immune response genes were identified. Gene ontology (GO) analysis revealed that the majority of the most enriched and meaningful biological process terms were mainly involved in immune response, inflammatory response, cell activation, leukocyte migration, cell adhesion, response to external stimulus, cell migration, and response to wounding. Also enriched were immune-related pathways and neural-related pathways. Similar to GO molecular function terms, the enriched terms were mainly related to cytokine receptor activity. Six DEGs were verified by quantitative real-time polymerase chain reaction (qRT-PCR). Protein-protein interaction analysis of these hits revealed that MCAO affects complement and coagulation cascades and chemokine signaling pathway. Our study identified novel biomarkers that could help further elucidate MCAO mechanisms and processes.
1. Introduction
Ischemic stroke is a leading cause of global mortality and morbidity. Immediately following the event, neurovascular reperfusion to the infarcted area can injure the tissue, resulting in more serious disability [1, 2]. Middle cerebral artery occlusion (MCAO) is a widely used model for studying neuroprotective therapies. For example, it was used to test the effectiveness of thrombolytic therapy [3, 4]. Thrombolysis is one of the most effective and economical treatments for ischemic stroke [5]. It is well known that brain damage can be exacerbated by reperfusion after thrombolysis [6]. Presumably, this secondary injury impacts multiple gene functions. Most existing studies have analyzed the functions of specific genes and signaling pathways. [7–9]. We propose that a broad analysis of gene expression changes could be used to develop better neuroprotectants for cerebral ischemia.
In recent decades, mRNA expression profiling performed by microarray or high-throughput RNA sequencing (RNA-seq) has been used to uncover molecular mechanisms and explore diagnostic and predictive biomarkers, particularly in complicated diseases such as diabetes, cancer, and stroke [10–12]. RNA-seq was applied for global gene expression profiling of the hippocampus following reperfusion with orexin-A [13]. Gaowa et al. performed RNA-seq to investigate transcriptome expression in a rat stroke model treated with the traditional Mongolian medicine Eerdun Wurile [14].
The main aim of this study was to identify protein-coding genes regulation networks 4 days after MCAO. RNA-seq was used to investigate the mRNA profiles in the brain tissue of rats subjected to MCAO. By a series of bioinformatics analyses, many immune-related pathways (B cell receptor signaling pathway, primary immunodeficiency, Fc epsilon RI signaling pathway, natural killer cell-mediated cytotoxicity, chemokine signaling pathway, cytokine-cytokine receptor interaction, complement and coagulation cascades, etc.) and neural-related pathways (neuroactive ligand-receptor interaction, neurotrophin signaling pathway) were identified, and six key genes were verified by quantitative real-time polymerase chain reaction (qRT-PCR).
2. Material and Methods
2.1. Animal Experiments and Sample Collection
Male Sprague Dawley rats (180-230 g, SPF grade) were obtained from the Experimental Animal Center of Anhui Medical University by Animal Experiments of Anhui university of Chinese medicine. All rats were anesthetized with sodium pentobarbital during all surgical procedures to minimize suffering, and the MCAO and sham surgeries were performed as previously described [15]. Four days after MCAO, the left hemispheres were collected and immediately frozen in liquid nitrogen.
2.2. RNA Extraction and Sequencing
Total RNA was extracted using mirVana™ miRNA Isolation kit (Cat# AM1561, Ambion, Foster City, CA) following the manufacturer's instructions. RNA sample quantity and quality were determined using a NanoDrop 2000 (Thermo Fisher Scientific, Waltham, MA) and an Agilent 2100 bioanalyzer (Agilent Technologies, Santa Clara, CA). TruSeq® Stranded Total RNA Sample Preparation kits (Illumina, San Diego, CA) were used to prepare libraries following the manufacturer's instructions. Purified libraries were quantified by a Qubit® 2.0 Fluorometer (Life Technologies, Carlsbad, CA) and Agilent 2100 bioanalyzer. Clusters were generated by cBot with the library and sequenced on an Illumina HiSeq 2500 platform (San Diego, CA). All sequencing was performed at Origin-Biotech Inc. (Ao-Ji Biotech, Shanghai, China).
2.3. DEG Analysis
FastQC was conducted for Quality control (QC) of RNA-seq reads (v. 0.11.3) (http://www.bioinformatics.babraham.ac.uk/projects/fastqc). Trimming was performed by seqtk for known Illumina TruSeq adapter sequences, poor reads, and ribosome RNA reads (https://github.com/lh3/seqtk). The trimmed reads were then mapped to the Rattus norvegicus reference genome (rno6) by the Hisat2 (version: 2.0.4) [16, 17]. StringTie (version: 1.3.0) was performed for each gene count from trimmed reads [17, 18]. Gene counts were normalized by trimmed mean of M-values (TMM) [19], and fragments per kilobase of transcript per million mapped reads (FPKM) in Perl script [20]. edgeR was performed for determining differential expression genes [21] and threshold with p<0.05 and absolute values of log2 (fold change) >1 [22].
2.4. Functional Enrichment Analysis
GO and KEGG pathways were enriched by R package (v 3.5.1) to better understand the functions of the DEGs [23]. In our study, clusterProfiler was applied to analysis of GO terms and KEGG pathways, and the top 30 GOs and pathways are presented [24].
2.5. PPI Network Construction and Module Analysis
STRING is a database that provides comprehensive information about interactions between proteins, including prediction and experimental interaction data [25]. In our study, the STRING tool was used to map PPIs among the DEGs considering interactions of combined scores ≥0.4. Then, Cytoscape was used to visualize the network [26]. The PPI network was used to filter modules based on the Molecular Complex Detection plug-in (MCOD) in Cytoscape [27] with standard set following degree cut-off=2, k-core=2, node score cut-off=0.2, and max depth=100. An MCODE score ≥4 and node ≥10 were considered for functional enrichment analysis of the modules. GO and KEGG enrichment for DEGs in the four modules were performed in clusterProfiler.
2.6. Validation of Differentially Expressed mRNAs from the qRT-PCR Sequencing Profile
qRT-PCR is the gold standard of mRNA detection and was performed to verify the RNA-seq results. Glyceraldehyde 3-phosphate dehydrogenase (GAPDH) served as the internal control. Relative mRNA expression was determined using the 2-ΔΔCT method. Six genes were analyzed: Top2a, Cdk1, Ccna2, Ccnb1, Th, and Esr1. Brain tissue was sequenced from the MCAO and control groups (n=3/group), and each experiment was performed in triplicate.
3. Results
3.1. DEG Screening
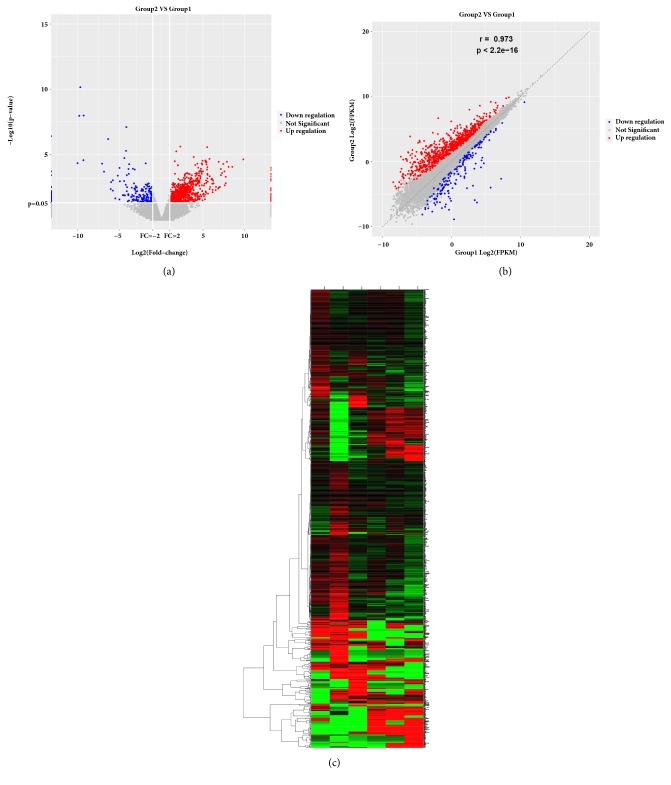
EdgeR software was used to screen DEGs with p<0.05 and |log2FC|>1. We identified 1,007 DEGs: 785 upregulated and 222 downregulated. Differential mRNA expression between the MCAO and control groups was represented in volcano and scatter plots (Figures 1(a) and 1(b)). Hierarchical clustering of DEGs was visualized (Figure 1(c)). The top 20 up- and downregulated DEGs are listed in Tables 1 and 2.
Figure 1.
Differentially expressed genes between the MCAO and control groups. (a) DEGs displayed on a volcano plot. Blue and red indicate >twofold decreased and increased expression in MCAO, respectively (p<0.05). Gray indicates no significant difference. (b) Differentially expressed genes were displayed on a scatter plot. Blue and red indicate >twofold decreased and increased expression in MCAO, respectively (p<0.05). Gray indicates no significant difference. (c) Hierarchical clustering; numbers were the samples used for RNA sequencing.
Table 1.
Detailed information of the top 20 upregulated mRNAs in MCAO brain.
| gene id | gene name | log2FC | P value |
|---|---|---|---|
| ENSRNOG00000051911 | Rbp3 | 9.837019121 | 2.34E-05 |
| ENSRNOG00000011672 | Tph1 | 8.512322575 | 8.73E-05 |
| ENSRNOG00000009907 | Mmp8 | 8.080531694 | 8.84E-05 |
| ENSRNOG00000010478 | LOC299282 | 7.867067702 | 3.61E-05 |
| ENSRNOG00000015336 | Isl2 | 7.734722642 | 0.001563164 |
| ENSRNOG00000007889 | Aipl1 | 7.722506427 | 0.000503613 |
| ENSRNOG00000000507 | Tulp1 | 7.615402628 | 0.002259611 |
| ENSRNOG00000007178 | Cd8a | 7.570686941 | 0.000201036 |
| ENSRNOG00000007159 | Ccl2 | 7.440623365 | 5.30E-05 |
| ENSRNOG00000061895 | LOC690045 | 7.288812262 | 0.000261728 |
| ENSRNOG00000019296 | Gnat2 | 7.142710312 | 0.000377842 |
| ENSRNOG00000045729 | AC117058.1 | 7.138284224 | 0.000129134 |
| ENSRNOG00000014787 | Cabp5 | 7.034279622 | 0.003090557 |
| ENSRNOG00000022859 | Trem1 | 6.919106867 | 0.003415102 |
| ENSRNOG00000009334 | Knstrn | 6.883192814 | 3.60E-05 |
| ENSRNOG00000006365 | Asb15 | 6.822955248 | 0.004125641 |
| ENSRNOG00000017625 | Htr2b | 6.556162157 | 0.003028595 |
| ENSRNOG00000059237 | AABR07068851.1 | 6.516677359 | 0.005448754 |
| ENSRNOG00000046216 | RGD1561778 | 6.269597389 | 0.001656204 |
| ENSRNOG00000046962 | Pde6g | 6.208987117 | 0.000981813 |
Table 2.
Detailed information of the top 20 downregulated mRNAs in MCAO brain.
| gene id | gene name | log2FC | P value |
|---|---|---|---|
| ENSRNOG00000008890 | Slc18a2 | -4.443186456 | 0.00106392 |
| ENSRNOG00000059292 | AABR07064373.1 | -4.454664062 | 0.012966988 |
| ENSRNOG00000012647 | Nkx2-4 | -4.580004547 | 0.013461308 |
| ENSRNOG00000005367 | Slc12a1 | -4.940598177 | 0.001152078 |
| ENSRNOG00000020410 | Th | -4.990029512 | 0.000109126 |
| ENSRNOG00000024729 | Pax5 | -4.996430332 | 0.027951932 |
| ENSRNOG00000003880 | Tph2 | -5.191719646 | 0.00042696 |
| ENSRNOG00000060020 | C1ql4 | -5.489455912 | 0.023686047 |
| ENSRNOG00000003695 | Mgat4d | -5.785311542 | 0.000949915 |
| ENSRNOG00000011335 | Gpr50 | -5.787166984 | 0.005797422 |
| ENSRNOG00000004451 | Mc3r | -5.997698916 | 0.001320591 |
| ENSRNOG00000016613 | Hoxc4 | -6.046260393 | 0.00436611 |
| ENSRNOG00000010053 | Calcr | -6.355736461 | 6.56E-07 |
| ENSRNOG00000003476 | Slc6a4 | -6.847488383 | 0.000207349 |
| ENSRNOG00000007608 | Fezf1 | -7.085814019 | 4.92E-05 |
| ENSRNOG00000037600 | Sim1 | -9.291469805 | 1.05E-08 |
| ENSRNOG00000017302 | Slc6a3 | -9.332130194 | 2.70E-05 |
| ENSRNOG00000021225 | Oxt | -9.69339756 | 7.12E-11 |
| ENSRNOG00000021229 | Avp | -9.81990178 | 1.10E-08 |
| ENSRNOG00000004632 | Pmch | -10.02651105 | 4.67E-05 |
3.2. GO Functional Enrichment Analysis of DEGs
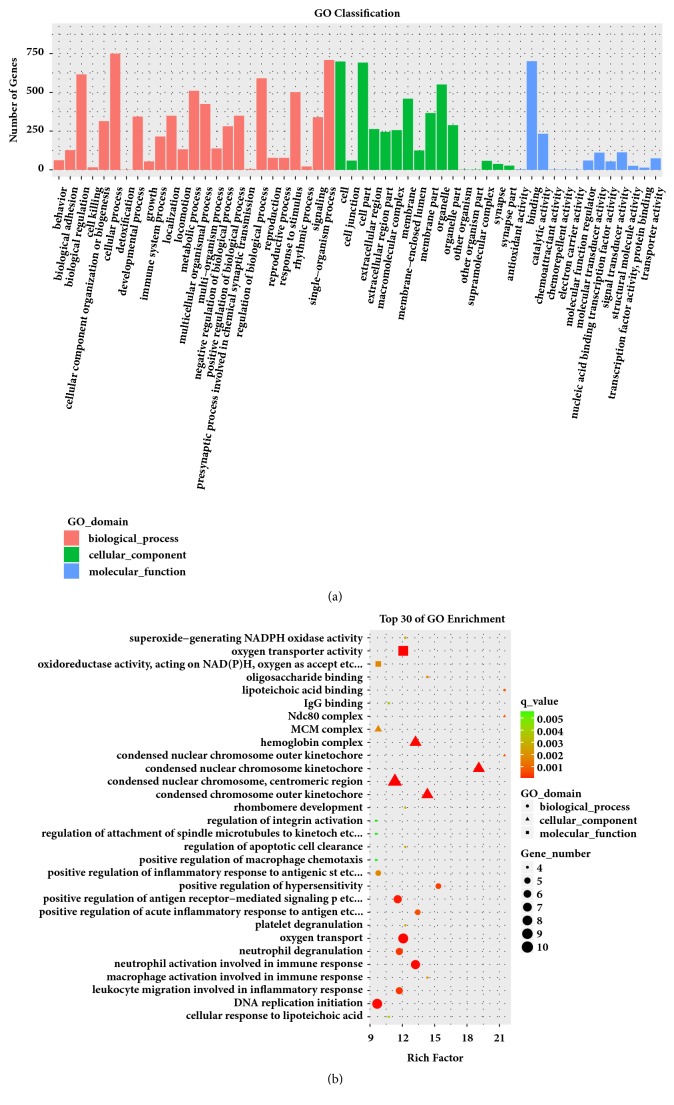
GO enrichment analysis was performed with 1,007 DEGs in clusterProfiler. The DEGs between the MCAO and control groups were enriched to 54 subclasses of GOs, and the top 30 subclasses are shown in Figure 2(a). The top 10 enriched GO biological processes were immune system process, immune response, cell activation, leukocyte migration, response to external stimulus, cell migration, response to wounding, inflammatory response, cell adhesion, and regulation of immune system process. The top 10 enriched cellular components were extracellular space, chromosome, cell surface, extracellular region, nucleosome, vesicle, external side of plasma membrane, kinetochore, condensed chromosome kinetochore, and protein-DNA complex. The enriched GO molecular functions were protein binding (GO:0005515), protein complex binding (GO:0032403), protein heterodimerization activity (GO:0046982), oxygen transporter activity (GO:0005344), lipid binding (GO:0008289), protein dimerization activity (GO:0046983), oxygen binding (GO:0019825), glycosaminoglycan binding (GO:0005539), cytokine receptor activity (GO:0004896), and iron ion binding (GO:0005506). These data are shown in Figure 2.
Figure 2.
Gene Ontology (GO) enrichment analysis results for all DEGs. (a) Classification of GO enrichment terms. (b) Top 30 classes of GO enrichment terms.
3.3. Pathway Enrichment Analysis of DEGs
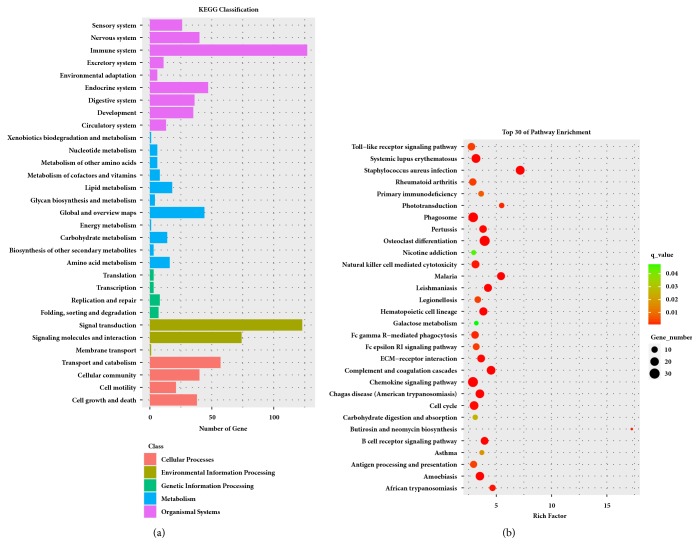
Pathway enrichment analysis of DEGs could provide further insight into the function of genes and their interactions. The DEGs between the MCAO and control groups were enriched to 31 subclasses of pathways in 5 broad categories (cellular processes, genetic information processing, organic systems, metabolism, and environmental information processing) after these were analyzed using the KEGG database (Figure 3(a)). We performed KEGG pathway enrichment analysis for DEGs and found 237 pathway terms including 77 that were significant (p< 0.05). The top 10 pathways with the greatest enrichment were Staphylococcus aureus infection (rno05150), osteoclast differentiation (rno04380), complement and coagulation cascades (rno04610), malaria (rno05144), leishmaniasis (rno05140), chemokine signaling pathway (rno04062), Chagas disease (American trypanosomiasis) (rno05142), hematopoietic cell lineage (rno04640), amoebiasis (rno05146), and phagosome (rno04145). The top 30 enrichment pathways are presented in Figure 3(b).
Figure 3.
KEGG pathway enrichment analysis results for all DEGs. (a) Classification of pathway enrichment terms. (b) Top 30 classes of pathway enrichment terms.
3.4. PPI Network
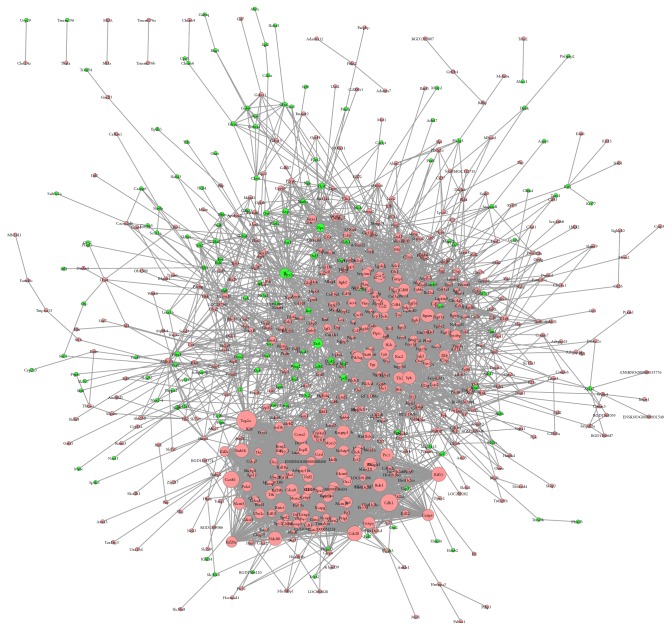
Significantly altered DEGs were used to construct a PPI network based on the STRING database. The network comprises 744 nodes and 5,266 interactions (Figure 4). More than 100 genes of connectivity degrees were >100, and the details of the top 10 genes with connectivity degrees were listed (Table 3), including Top2a (topoisomerase [DNA] II alpha, degree=121, FC=38.80), Cdk1 (cyclin-dependent kinase 1, degree=104, FC=25.09), Ccna2 (cyclin A2, degree=98, FC= 28.73), Ccnb1 (G2/mitotic-specific cyclin-B1, degree=96, FC=8.072), Th (tyrosine hydroxylase, degree=46, FC=0.03147), and Esr1 (estrogen receptor 1, degree=18, FC=0.2192).
Figure 4.
PPI network of the DEGs. Node size is related to node degree. Pink and green nodes denote up- and downregulated genes, respectively. PPI: protein-protein interaction; DEGs: differentially expressed genes.
Table 3.
Top 10 degrees of up- and downregulated DEGs.
| Gene_name | log2FC | P value | Up/down | PPI_node_degree |
|---|---|---|---|---|
| Top2a | 5.278098 | 2.91E-05 | UP | 121 |
| Cdk1 | 4.649292 | 0.000415 | UP | 104 |
| Ccna2 | 4.844517 | 4.87E-05 | UP | 98 |
| Ccnb1 | 3.01E+00 | 0.005115 | UP | 96 |
| Cdc20 | 2.615553 | 0.007635 | UP | 86 |
| Kif11 | 4.063773 | 6.35E-05 | UP | 83 |
| Ccl2 | 7.440623 | 5.3E-05 | UP | 79 |
| Itgam | 2.150151 | 0.004347 | UP | 78 |
| Ndc80 | 3.562942 | 0.005167 | UP | 78 |
| Plk1 | 2.267746 | 0.013009 | UP | 78 |
| Th | -4.99003 | 0.000109 | DOWN | 46 |
| Esr1 | -2.18964 | 0.005317 | DOWN | 44 |
| Nps | -∞ | 0.035781 | DOWN | 36 |
| Htr2a | -1.0935 | 0.002992 | DOWN | 26 |
| Ppef1 | -2.41715 | 0.038577 | DOWN | 24 |
| Prkg2 | -1.00732 | 0.029108 | DOWN | 24 |
| Pcsk1 | -1.04925 | 0.04309 | DOWN | 22 |
| Calb2 | -2.19721 | 0.005492 | DOWN | 20 |
| Ret | -1.7584 | 0.004092 | DOWN | 20 |
| Avp | -9.8199 | 1.1E-08 | DOWN | 19 |
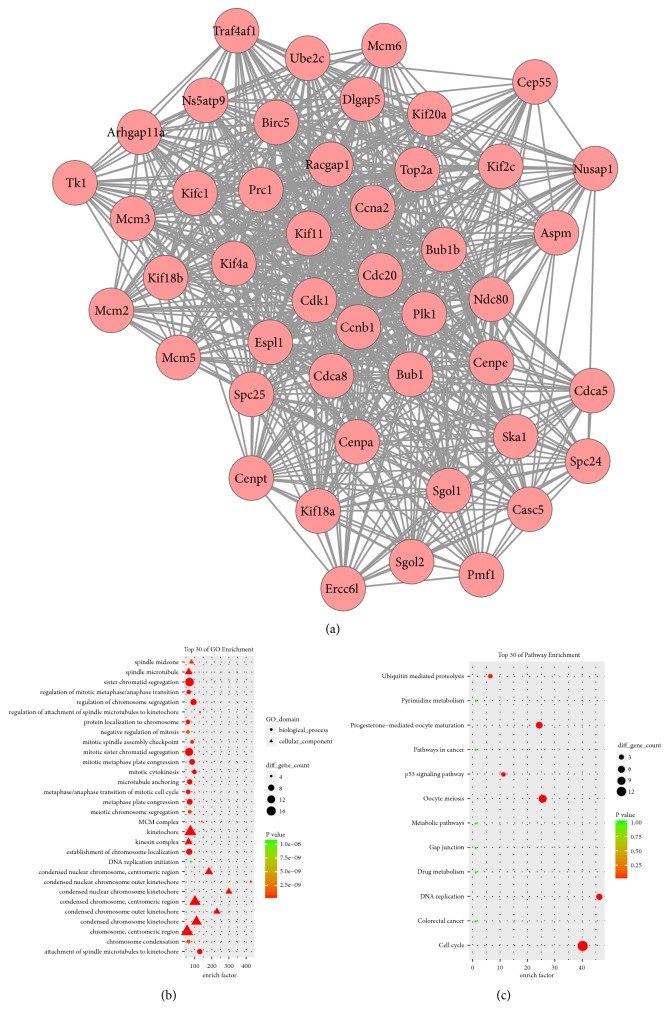
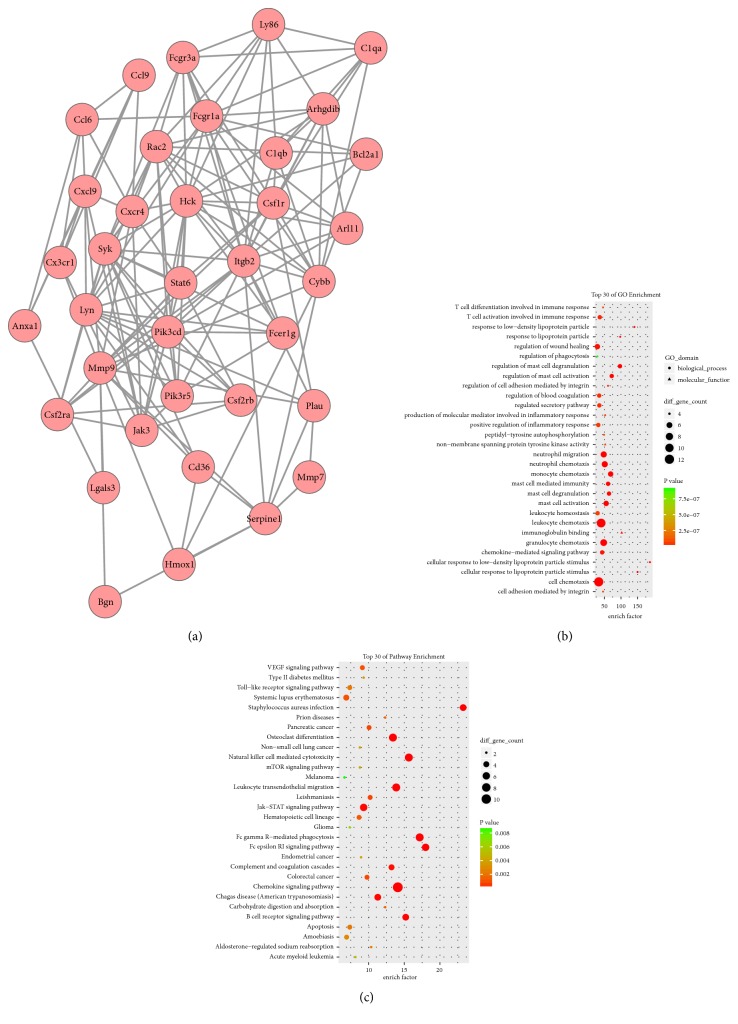
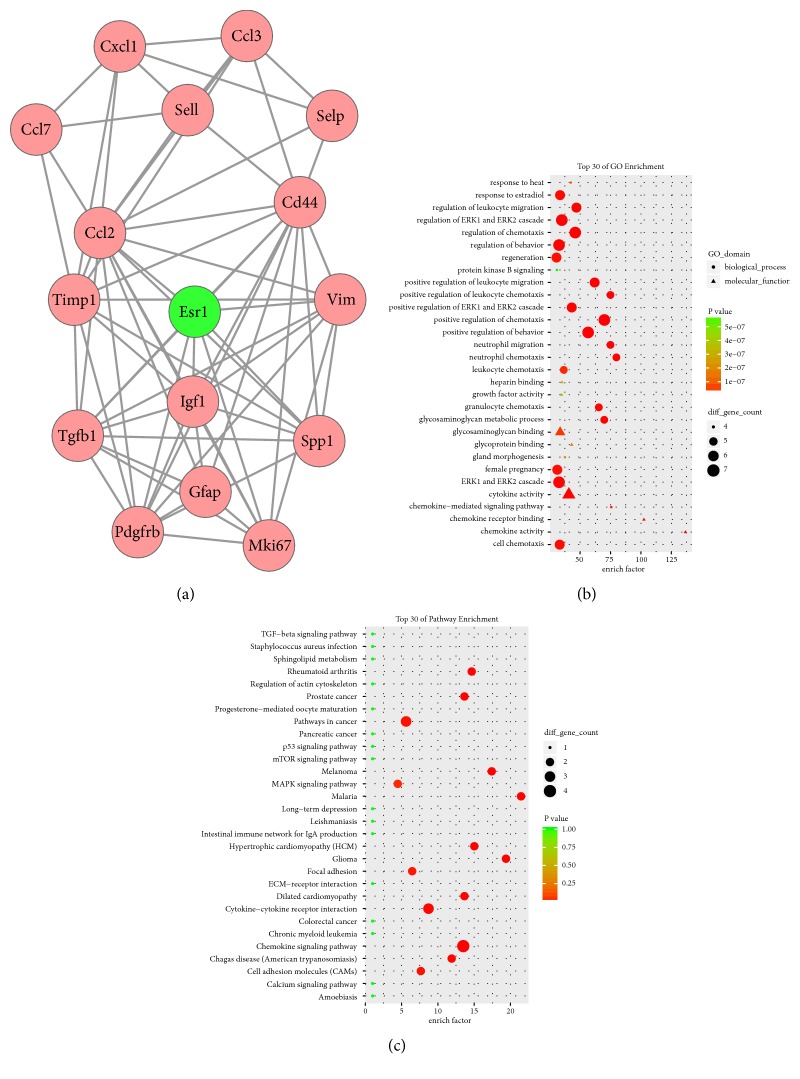
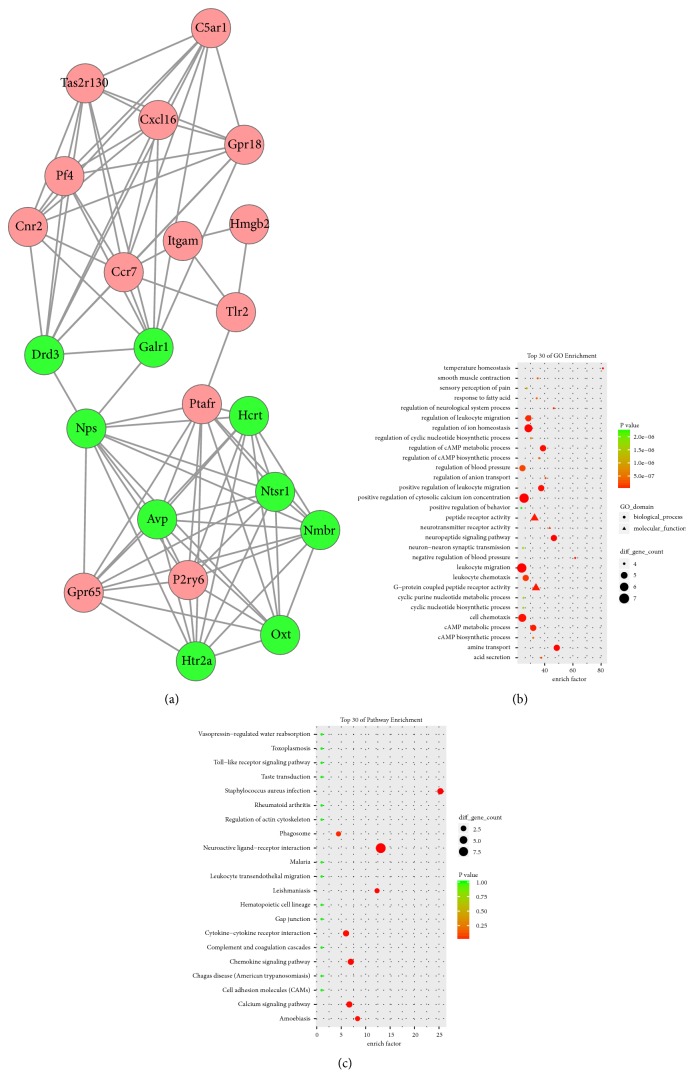
A total of 25 modules were obtained using default criteria in MCODE. Modules were listed in descending order by MCODE score. Four modules with MCODE score ≥4 and nodes ≥10 were named modules 1, 2, 3, and 4. These were selected for module network visualization, GO enrichment analysis, and KEGG pathway enrichment analysis (Figures 5–8). Most DEGs in these modules were upregulated in the MCAO group, especially in modules 1 and 2.
Figure 5.
Network, GO enrichment, and pathway enrichment of DEGs involved in module 1. (a) Significant module 1 of the PPI network. (b) Classification of GO enrichment terms. (b) KEGG pathway enrichment terms. Pink and green nodes denote up- and downregulated genes, respectively. PPI: protein-protein interaction; DEGs: differentially expressed genes.
Figure 6.
Network, GO enrichment, and pathway enrichment of DEGs were involved in module 2. (a) Significant module 2 of the PPI network. (b) Classification of GO enrichment terms. (b) KEGG pathway enrichment terms. Pink and green nodes denote up- and downregulated genes, respectively. PPI: protein-protein interaction; DEGs: differentially expressed genes.
Figure 7.
Network, GO enrichment, and pathway enrichment of DEGs were involved in module 3. (a) Significant module 3 of the PPI network. (b) Classification of GO enrichment terms. (b) KEGG pathway enrichment terms. Pink and green nodes denote up- and downregulated genes, respectively. PPI: protein-protein interaction; DEGs: differentially expressed genes.
Figure 8.
Network, GO enrichment, and pathway enrichment of DEGs involved in module 4. (a) Significant module 4 of the PPI network. (b) Classification of GO enrichment terms. (b) KEGG pathway enrichment terms. Pink and green nodes denote up- and downregulated genes, respectively. PPI: protein-protein interaction; DEGs: differentially expressed genes.
3.5. qRT-PCR Verification of the DEGs
Top2a, Cdk1, Ccna2, and Ccnb1 were overexpressed in the MCAO group (Figure 9). Th and Esr1 had lower expression in the MCAO for both RNA-seq and qRT-PCR. We successfully verified that the RNA-seq and qRT-PCR results were consistent, indicating that the RNA-seq results were reliable. The primers are listed in Table 4.
Figure 9.
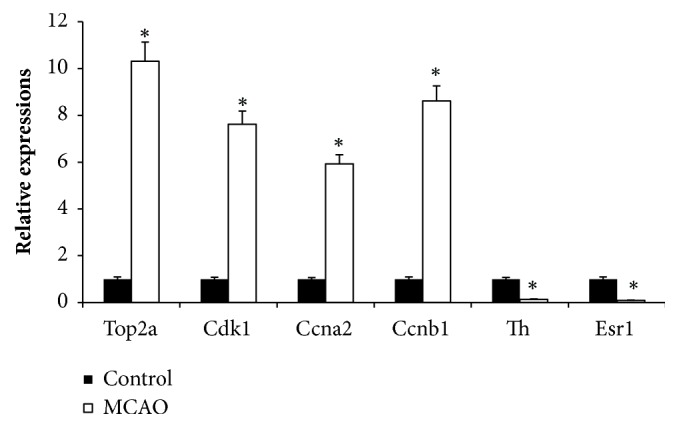
qRT-PCR verification of DEGs. Brain tissue expression of six genes was detected by qRT-PCR and is shown as expression fold changes. GAPDH was the internal control.
Table 4.
Primer sequences.
| Gene | Sequences | PCR product length (bp) |
|---|---|---|
| GAPDH | F: CCTGGTATGACAACGAATTTG | 131 |
| R: CAGTGAGGGTCTCTCTCTTCC | ||
| Top2a | F: CAGCAGAAGGTCCCAGAAGA | 100 |
| R: GGTAGTTGAAGGTCGGTCCA | ||
| Cdk1 | F: GTACGGCAATCCGGGAAATC | 98 |
| R: GAGATACAGCCTGGAGTCCT | ||
| Ccna2 | F: AGCTCTCTACACAGTCACAGG | 106 |
| R: GGTCTGGTGAAGGTCCATGA | ||
| Ccnb1 | F: CAGGGTCACTAGGAACACGA | 121 |
| R: AGCAGTTCTCGATCTCAGCA | ||
| Th | F: GTCGGAAGCTGATTGCAGAG | 129 |
| R: TAGCATAGAGGCCCTTCAGC | ||
| Esr1 | F: CCAGCTCCTCCTCATCCTTT | 101 |
| R: GGTCATAGAGAGGCACGACA |
4. Discussion
We analyzed the protein-coding mRNA expression profiles in cerebral hemispheres from experimental and control rats by high-throughput RNA-seq. This identified 1,007 DEGs, which were subjected to GO, KEGG pathway, PPI, and PPI module analysis to provide a better understanding of pathological mechanisms that occur after MCAO.
4.1. Cell Cycle
Pathway enrichment analysis identified 21 DEGs enriched for the cell cycle (P value=1.25E-05), namely, Mcm6, Ttk, Bub1b, Cdkn2c, Ccnb1, Bub1, Plk1, Orc1, Tgfb1, Mcm3, Cdc6, Mcm5, Pttg1, Cdc20, Chek2, Ccnd1, Mcm2, Espl1, Rbl1, Cdk1, and Ccna2. Most were upregulated in MCAO. Following Cyclin A (Ccna2, FC= 28.73) or B (Ccnb1, FC=8.07) binding and activating cyclin-dependent kinase 1 (Cdk1, FC=25.09), Cdk1 phosphorylates key substrates leading the cell to G2-phase arrest, M-phase, and cytokinesis promotion. Some studies reported that Cdk1 activation is involved in multiple neuronal death by activating phosphorylation of Bad27 (a proapoptotic protein) or inhibitory phosphorylation of Bcl-xL, Bcl-2, and Mcl-1, which are antiapoptotic [28, 29]. Others described similar results in transient ischemia [28, 30]. Besides the Bcl-2 family, Cdk1 also phosphorylates the transcription factor FOXO1, which is also implicated in cell death [31]. We hypothesize that during MCAO, Cdk1 induces ischemic neuronal death by Bcl2 family or Foxo1 promoting signaling pathways.
4.2. Inflammatory Response
GO enrichment analysis revealed that more than 78 DEGs are involved in the inflammatory response (p=0.0078), including 75 that were upregulated. Several inflammatory response pathways were activated like complement and coagulation cascades, chemokine signaling pathway, natural killer cell-mediated cytotoxicity, and leukocyte transendothelial migration. Dozens of cytokines were dysregulated. The macrophage recruitment factor CCL2 [32–34] was upregulated, and CD68 and CD163 were dysregulated. Therefore, we hypothesize that MCAO could lead to the recruitment and induction of macrophages, natural killer cells, and leukocytes. The specific cell subsets will require further verification.
4.3. Neuroactive Ligand-Receptor Interaction
Pathway enrichment analysis showed that 27 DEGs were involved in the neuroactive ligand-receptor interaction (p=0.00832); 10 and 17 were up- and downregulated, respectively. Upregulated receptors in MCAO were Htr2b, Gabrr1, C5ar1, Cnr2, P2ry6, Htr2a, Galr1, C3ar1, Glra1, and Mc3r. Downregulated receptors in MCAO were Gabrr3, Gabrq, Brs3, Gabra6, Cckar, Trhr, Ptafr, Glra2, Chrnb4, Gpr50, Gabre, Tspo, P2rx2, Ntsr1, Chrna6, Calcr, and Drd3. Lan et al. found decreased serotonin receptor expression in MCAO rats, which was improved with treadmill exercise [35]. We found that Htr2a and Htr2b were upregulated in MCAO group. We hypothesize that MCAO could induce Htr2a and Htr2b overexpression leading to excitability in the early stage of ischemia. Other studies have shown suppression of GABAA and glycine receptors in rats with MCAO, and receptor agonists could improve it [36, 37]. Our results show that some subunits of GABBA (e.g., Gabrr3, Gabrq, Gabra6, Gabre, and Gabrr1) were dysregulated following MCAO.
5. Conclusions
By high-throughput RNA-seq, we analyzed the protein-coding mRNA expression profile in control and MCAO groups in brain tissue. And some GOs, pathways, and genes that were identified could play key roles with MCAO. These findings may help us to understand the underlying mechanism of protein-coding mRNAs with MCAO.
Acknowledgments
The authors gratefully acknowledge financial support from the National Key Research and Development Plan (grant nos. 2017YFC1701600 and 2017YFC1701601), National Natural Science Foundation of China (grant no. 81473387), Anhui Provincial Natural Science Foundation of China (grant no. 1508085QH191), and Key Project of the National Science Fund of Anhui Province (KJ2017A282 and KJ2017A284). We thank Mr. Qiang Fan (Ao-Ji Bio-tech Co., Ltd., Shanghai, China) for assisting with the data analysis.
Data Availability
The data used to support the findings of this study are available from the corresponding author upon request.
Conflicts of Interest
The authors declare that there are no conflicts of interest regarding the publication of this paper.
References
- 1.Jung J. E., Kim G. S., Chen H., et al. Reperfusion and neurovascular dysfunction in stroke: from basic mechanisms to potential strategies for neuroprotection. Molecular Neurobiology. 2010;41(2-3):172–179. doi: 10.1007/s12035-010-8102-z. [DOI] [PMC free article] [PubMed] [Google Scholar]
- 2.Kalogeris T., Baines C. P., Krenz M., Korthuis R. J. Ischemia/reperfusion. Comprehensive Physiology. 2017;7(1):113–170. doi: 10.1002/cphy.c160006. [DOI] [PMC free article] [PubMed] [Google Scholar]
- 3.Ryang Y.-M., Dang J., Kipp M., et al. Solulin reduces infarct volume and regulates gene-expression in transient middle cerebral artery occlusion in rats. BMC Neuroscience. 2011;12 doi: 10.1186/1471-2202-12-113. [DOI] [PMC free article] [PubMed] [Google Scholar]
- 4.Nieswandt B., Kleinschnitz C., Stoll G. Ischaemic stroke: A thrombo-inflammatory disease? The Journal of Physiology. 2011;589(17):4115–4123. doi: 10.1113/jphysiol.2011.212886. [DOI] [PMC free article] [PubMed] [Google Scholar]
- 5.Lopes R. D., Piccini J. P., Hylek E. M., Granger C. B., Alexander J. H. Antithrombotic therapy in atrial fibrillation: Guidelines translated for the clinician. Journal of Thrombosis and Thrombolysis. 2008;26(3):167–174. doi: 10.1007/s11239-008-0272-4. [DOI] [PubMed] [Google Scholar]
- 6.Nour M., Scalzo F., Liebeskind D. S. Ischemia-Reperfusion Injury in Stroke. Interventional Neurology. 2012;1(3-4):185–199. doi: 10.1159/000353125. [DOI] [PMC free article] [PubMed] [Google Scholar]
- 7.McDonough A., Lee R. V., Noor S., et al. Ischemia/Reperfusion Induces Interferon-Stimulated Gene Expression in Microglia. The Journal of Neuroscience. 2017;37(34):8292–8308. doi: 10.1523/JNEUROSCI.0725-17.2017. [DOI] [PMC free article] [PubMed] [Google Scholar]
- 8.Guo H., Adah D., James P. B., et al. Xueshuantong Injection (Lyophilized) Attenuates Cerebral Ischemia/Reperfusion Injury by the Activation of Nrf2–VEGF Pathway. Neurochemical Research. 2018;43(5):1096–1103. doi: 10.1007/s11064-018-2523-x. [DOI] [PubMed] [Google Scholar]
- 9.Xin Q., Cheng B., Pan Y., et al. Neuroprotective effects of apelin-13 on experimental ischemic stroke through suppression of inflammation. Peptides. 2015;63:55–62. doi: 10.1016/j.peptides.2014.09.016. [DOI] [PubMed] [Google Scholar]
- 10.Neelankal John A., Ram R., Jiang F.-X. RNA-Seq Analysis of Islets to Characterise the Dedifferentiation in Type 2 Diabetes Model Mice db/db. Endocrine Pathology. 2018;29:207–221. doi: 10.1007/s12022-018-9523-x. [DOI] [PubMed] [Google Scholar]
- 11.Mengozzi M., Cervellini I., Villa P., et al. Erythropoietin-induced changes in brain gene expression reveal induction of synaptic plasticity genes in experimental stroke. Proceedings of the National Acadamy of Sciences of the United States of America. 2012;109(24):9617–9622. doi: 10.1073/pnas.1200554109. [DOI] [PMC free article] [PubMed] [Google Scholar]
- 12.Le Guellec S., Lesluyes T., Sarot E., et al. Validation of the Complexity INdex in SARComas prognostic signature on formalin-fixed, paraffin-embedded, soft-tissue sarcomas. Annals of Oncology. 2018;29(8):1828–1835. doi: 10.1093/annonc/mdy194. [DOI] [PubMed] [Google Scholar]
- 13.Wang C.-M., Pan Y.-Y., Liu M.-H., Cheng B.-H., Bai B., Chen J. RNA-seq expression profiling of rat MCAO model following reperfusion Orexin-A. Oncotarget . 2017;8(68):113066–113081. doi: 10.18632/oncotarget.22995. [DOI] [PMC free article] [PubMed] [Google Scholar]
- 14.Gaowa S., Bao N., Da M., et al. Traditional Mongolian medicine Eerdun Wurile improves stroke recovery through regulation of gene expression in rat brain. Journal of Ethnopharmacology. 2018;222:249–260. doi: 10.1016/j.jep.2018.05.011. [DOI] [PubMed] [Google Scholar]
- 15.Han L., Ji Z., Chen W., et al. Protective Effects of Tao-Hong-Si-Wu Decoction on Memory Impairment and Hippocampal Damage in Animal Model of Vascular Dementia. Evidence-Based Complementary and Alternative Medicine. 2015;2015:12. doi: 10.1155/2015/195835.195835 [DOI] [PMC free article] [PubMed] [Google Scholar]
- 16.Kim D., Langmead B., Salzberg S. L. HISAT: a fast spliced aligner with low memory requirements. Nature Methods. 2015;12(4):357–360. doi: 10.1038/nmeth.3317. [DOI] [PMC free article] [PubMed] [Google Scholar]
- 17.Pertea M., Kim D., Pertea G. M., Leek J. T., Salzberg S. L. Transcript-level expression analysis of RNA-seq experiments with HISAT, StringTie and Ballgown. Nature Protocols. 2016;11(9):1650–1667. doi: 10.1038/nprot.2016.095. [DOI] [PMC free article] [PubMed] [Google Scholar]
- 18.Pertea M., Pertea G. M., Antonescu C. M., Chang T.-C., Mendell J. T., Salzberg S. L. StringTie enables improved reconstruction of a transcriptome from RNA-seq reads. Nature Biotechnology. 2015;33(3):290–295. doi: 10.1038/nbt.3122. [DOI] [PMC free article] [PubMed] [Google Scholar]
- 19.Robinson M. D., Oshlack A. A scaling normalization method for differential expression analysis of RNA-seq data. Genome Biology. 2010;11(3, article R25) doi: 10.1186/gb-2010-11-3-r25. [DOI] [PMC free article] [PubMed] [Google Scholar]
- 20.Mortazavi A., Williams B. A., McCue K., Schaeffer L., Wold B. Mapping and quantifying mammalian transcriptomes by RNA-Seq. Nature Methods. 2008;5(7):621–628. doi: 10.1038/nmeth.1226. [DOI] [PubMed] [Google Scholar]
- 21.Robinson M. D., McCarthy D. J., Smyth G. K. edgeR: a Bioconductor package for differential expression analysis of digital gene expression data. Bioinformatics. 2010;26(1):139–140. doi: 10.1093/bioinformatics/btp616. [DOI] [PMC free article] [PubMed] [Google Scholar]
- 22.Benjamini Y., Drai D., Elmer G., Kafkafi N., Golani I. Controlling the false discovery rate in behavior genetics research. Behavioural Brain Research. 2001;125(1-2):279–284. doi: 10.1016/S0166-4328(01)00297-2. [DOI] [PubMed] [Google Scholar]
- 23.Altermann E., Klaenhammer T. R. PathwayVoyager: pathway mapping using the Kyoto Encyclopedia of Genes and Genomes (KEGG) database. BMC Genomics. 2005;6, article 60 doi: 10.1186/1471-2164-6-60. [DOI] [PMC free article] [PubMed] [Google Scholar]
- 24.Ashburner M., Ball C. A., Blake J. A., et al. Gene ontology: tool for the unification of biology. Nature Genetics. 2000;25(1):25–29. doi: 10.1038/75556. [DOI] [PMC free article] [PubMed] [Google Scholar]
- 25.Szklarczyk D., Franceschini A., Kuhn M., et al. The STRING database in 2011: functional interaction networks of proteins, globally integrated and scored. Nucleic Acids Research. 2011;39(1):D561–D568. doi: 10.1093/nar/gkq973. [DOI] [PMC free article] [PubMed] [Google Scholar]
- 26.Shannon P., Markiel A., Ozier O., et al. Cytoscape: a software Environment for integrated models of biomolecular interaction networks. Genome Research. 2003;13(11):2498–2504. doi: 10.1101/gr.1239303. [DOI] [PMC free article] [PubMed] [Google Scholar]
- 27.Bader G. D., Hogue C. W. V. An automated method for finding molecular complexes in large protein interaction networks. BMC Bioinformatics. 2003;4 doi: 10.1186/1471-2105-4-2. [DOI] [PMC free article] [PubMed] [Google Scholar]
- 28.Terrano D. T., Upreti M., Chambers T. C. Cyclin-dependent kinase 1-mediated Bcl-xL/Bcl-2 phosphorylation acts as a functional link coupling mitotic arrest and apoptosis. Molecular and Cellular Biology. 2010;30(3):640–656. doi: 10.1128/MCB.00882-09. [DOI] [PMC free article] [PubMed] [Google Scholar]
- 29.Harley M. E., Allan L. A., Sanderson H. S., Clarke P. R. Phosphorylation of Mcl-1 by CDK1-cyclin B1 initiates its Cdc20-dependent destruction during mitotic arrest. EMBO Journal. 2010;29(14):2407–2420. doi: 10.1038/emboj.2010.112. [DOI] [PMC free article] [PubMed] [Google Scholar]
- 30.Wen Y., Yang S., Liu R., Brun-Zinkernagel A. M., Koulen P., Simpkins J. W. Transient cerebral ischemia induces aberrant neuronal cell cycle re-entry and Alzheimer's disease-like tauopathy in female rats. The Journal of Biological Chemistry. 2004;279(21):22684–22692. doi: 10.1074/jbc.m311768200. [DOI] [PubMed] [Google Scholar]
- 31.Yuan Z., Becker E. B. E., Merlo P., et al. Activation of FOXO1 by Cdk1 in cycling cells and postmitotic neurons. Science. 2008;319(5870):1665–1668. doi: 10.1126/science.1152337. [DOI] [PubMed] [Google Scholar]
- 32.Conductier G., Blondeau N., Guyon A., Nahon J.-L., Rovère C. The role of monocyte chemoattractant protein MCP1/CCL2 in neuroinflammatory diseases. Journal of Neuroimmunology. 2010;224(1-2):93–100. doi: 10.1016/j.jneuroim.2010.05.010. [DOI] [PubMed] [Google Scholar]
- 33.Semple B. D., Kossmann T., Morganti-Kossmann M. C. Role of chemokines in CNS health and pathology: a focus on the CCL2/CCR2 and CXCL8/CXCR2 networks. Journal of Cerebral Blood Flow & Metabolism. 2010;30(3):459–473. doi: 10.1038/jcbfm.2009.240. [DOI] [PMC free article] [PubMed] [Google Scholar]
- 34.Xu J., Dong H., Qian Q., et al. Astrocyte-derived CCL2 participates in surgery-induced cognitive dysfunction and neuroinflammation via evoking microglia activation. Behavioural Brain Research. 2017;332:145–153. doi: 10.1016/j.bbr.2017.05.066. [DOI] [PubMed] [Google Scholar]
- 35.Lan X., Zhang M., Yang W., et al. Effect of treadmill exercise on 5-HT, 5-HT1A receptor and brain derived neurophic factor in rats after permanent middle cerebral artery occlusion. Neurological Sciences. 2014;35(5):761–766. doi: 10.1007/s10072-013-1599-y. [DOI] [PubMed] [Google Scholar]
- 36.Wang G.-H., Jiang Z.-L., Fan X.-J., Zhang L., Li X., Ke K.-F. Neuroprotective effect of taurine against focal cerebral ischemia in rats possibly mediated by activation of both GABAA and glycine receptors. Neuropharmacology. 2007;52(5):1199–1209. doi: 10.1016/j.neuropharm.2006.10.022. [DOI] [PubMed] [Google Scholar]
- 37.Costa J. T., Mele M., Baptista M. S., et al. Gephyrin Cleavage in In Vitro Brain Ischemia Decreases GABAA Receptor Clustering and Contributes to Neuronal Death. Molecular Neurobiology. 2016;53(6):3513–3527. doi: 10.1007/s12035-015-9283-2. [DOI] [PubMed] [Google Scholar]
Associated Data
This section collects any data citations, data availability statements, or supplementary materials included in this article.
Data Availability Statement
The data used to support the findings of this study are available from the corresponding author upon request.


