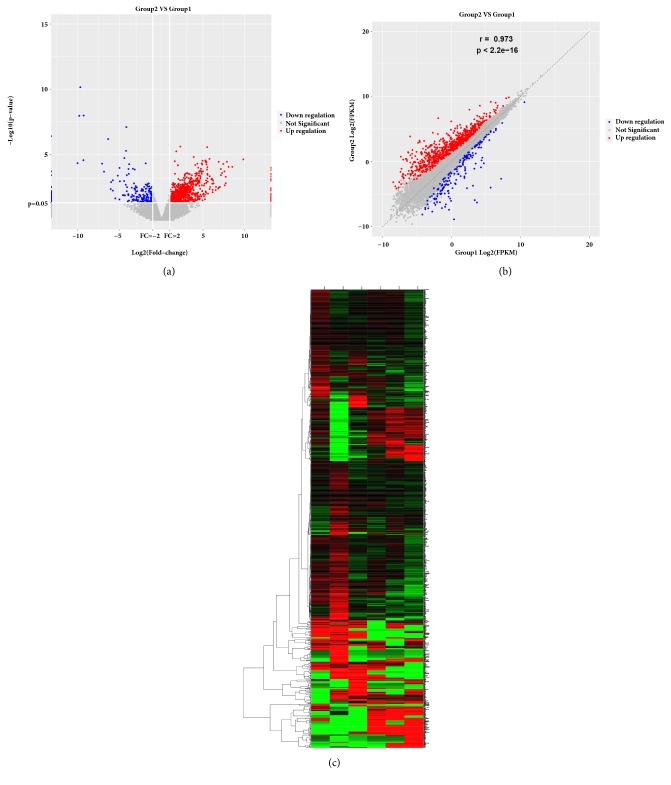
Figure 1.
Differentially expressed genes between the MCAO and control groups. (a) DEGs displayed on a volcano plot. Blue and red indicate >twofold decreased and increased expression in MCAO, respectively (p<0.05). Gray indicates no significant difference. (b) Differentially expressed genes were displayed on a scatter plot. Blue and red indicate >twofold decreased and increased expression in MCAO, respectively (p<0.05). Gray indicates no significant difference. (c) Hierarchical clustering; numbers were the samples used for RNA sequencing.

