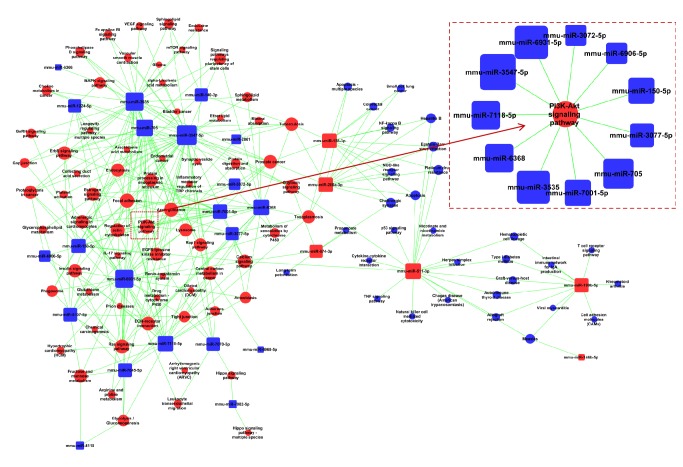
Figure 5.
MicroRNA-pathway-network. Red box nodes and blue box nodes represent upregulated miRNA and downregulated miRNA, respectively. Blue cycle nodes represent Pathway. Edges show the inhibitory effect of miRNA on Pathway. When the area of box or circle is larger, the degree of the miRNA or pathway is bigger. The sub-network extracted from the whole network includes the key miRNAs and pathways.

