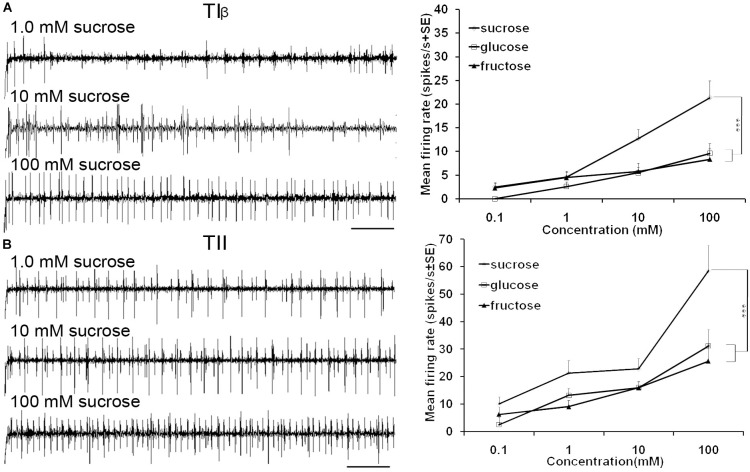
FIGURE 5.
Dose-response recordings of TIβ, and TII tarsal taste sensilla associated with fifth tarsomere of female S. littoralis to (0.1–100 mM) sucrose, fructose, and glucose. Response properties of TIβ taste sensilla (N1-Neuron) (A) and TII sensilla (N2-Neuron) (B). Scale bar is 200 ms (n = 8). Errors bars represent standard error. Asterisks indicate a significant difference between stimuli (p < 0.001).

