
Figure 2.
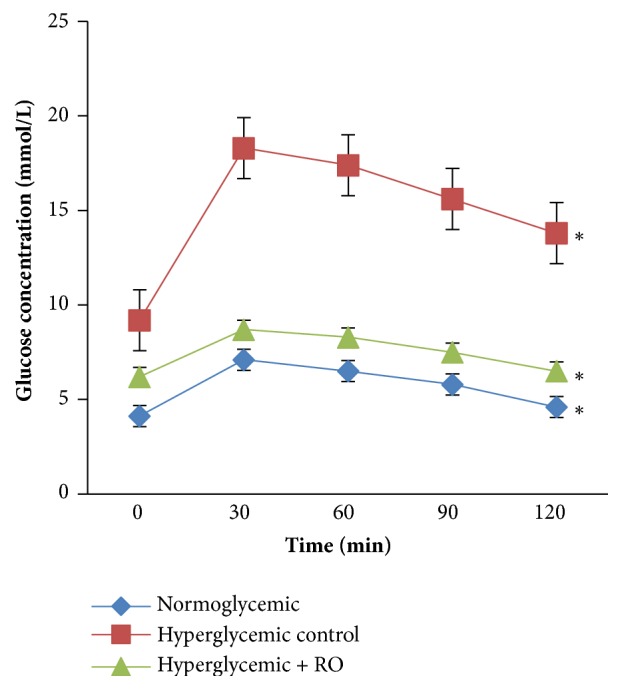
Effect of RO on OGTT in normoglycemic and hyperglycemic rabbits. Data are represented as mean ± SEM for 3 animals per group. ∗Significantly different levels compared to the normoglycemic group (p<0.05).
Official websites use .gov
A
.gov website belongs to an official
government organization in the United States.
Secure .gov websites use HTTPS
A lock (
) or https:// means you've safely
connected to the .gov website. Share sensitive
information only on official, secure websites.
Effect of RO on OGTT in normoglycemic and hyperglycemic rabbits. Data are represented as mean ± SEM for 3 animals per group. ∗Significantly different levels compared to the normoglycemic group (p<0.05).