
Figure 4.
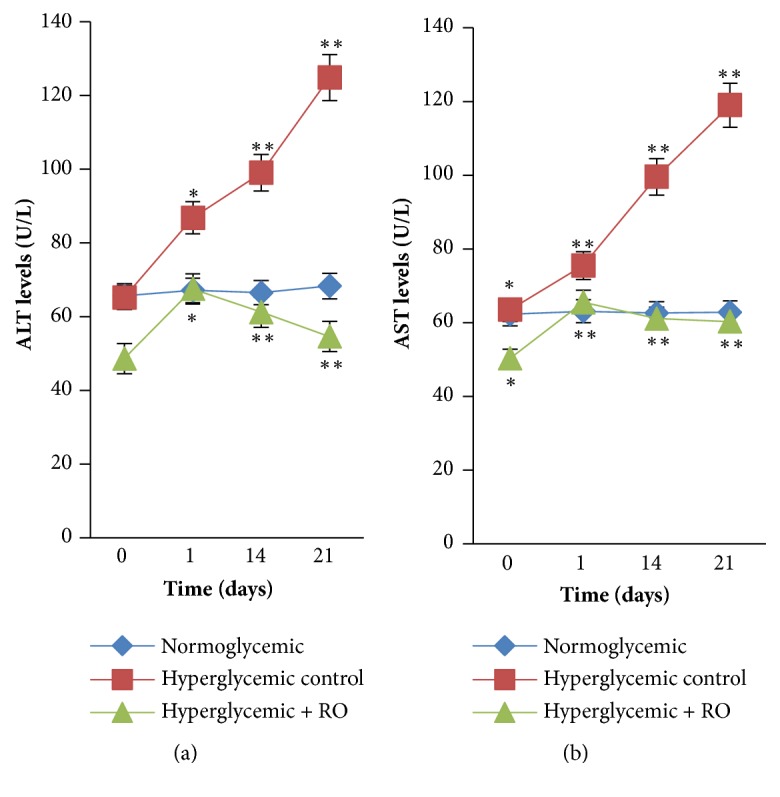
Effect of RO ethanol extract on liver enzyme (ALT, (a)) and (AST, (b)) levels. ∗Significantly different levels compared to the normoglycemic group (p<0.05). ∗∗ Significantly different levels compared to the hyperglycemic control group (p<0.05). Data are represented as mean ± SEM for 3 animals per group.