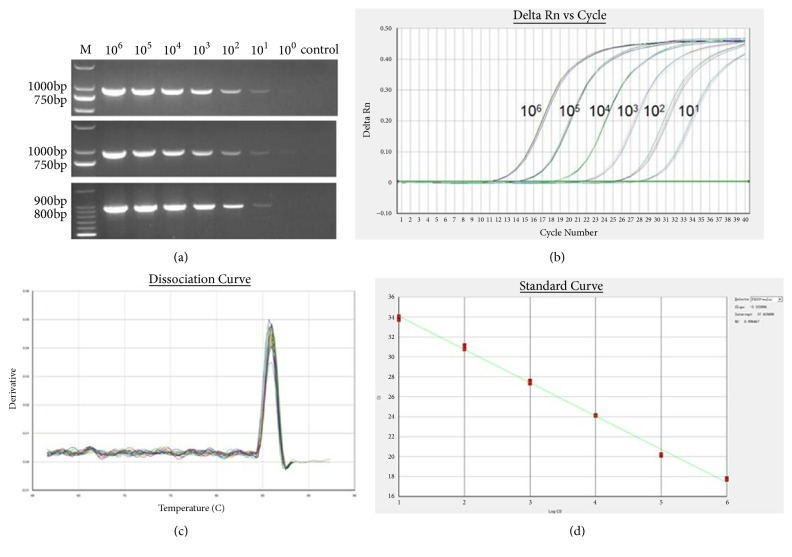
Figure 1.
Sensitivity of RT-PCR and RT-qPCR. (a) Amplification of 10-fold dilutions of standard RNA, which was achieved by conventional RT-PCR technique in three different days. (b) Amplification of 10-fold dilutions of RNA standard by RT-qPCR in triplicates. (c) Analysis of dissolution curve of real-time RT-PCR products. (d) A standard curve of RT-qPCR, which was generated by plotting mean Ct values versus 10-fold dilutions of RNA standard in triplicates.

