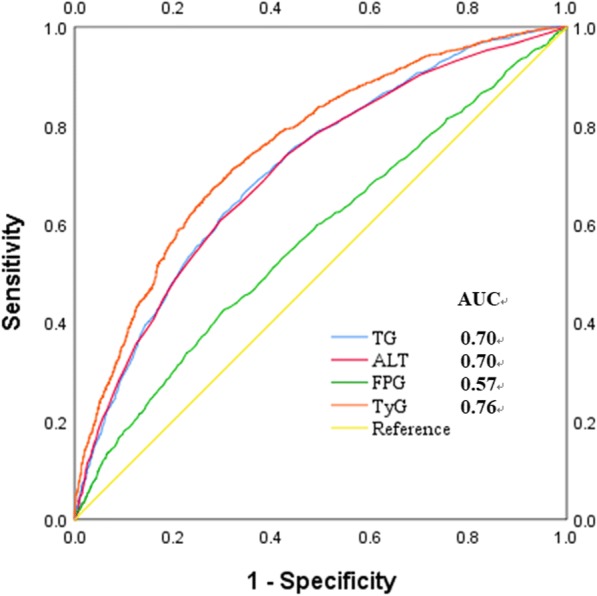
Fig. 5.

Receiver operative characteristic (ROC) curves and corresponding areas under the curve (AUC) for NAFLD. The AUC of TG, ALT, FPG and TyG were 0.70 (95% CI 0.69–0.72), 0.70 (95% CI 0.69–0.72), 0.57 (95% CI 0.55–0.59) and 0.76 (95% CI 0.74–0.77), respectively. p values for the difference between TyG and other two AUCs were < 0.0001
