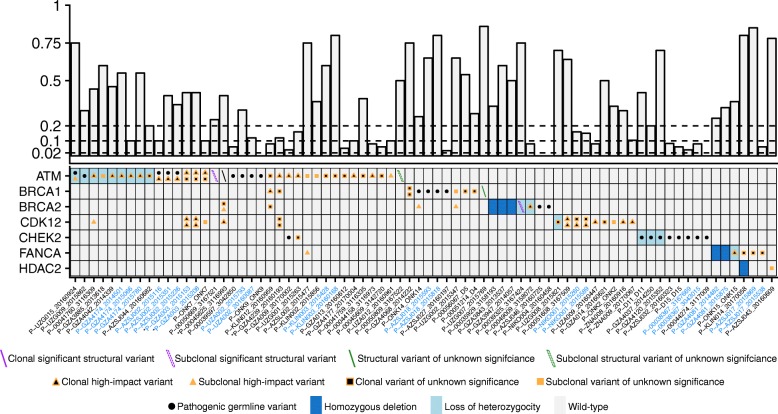
Fig. 5.
Alterations in genes associated with DNA repair deficiency. The upper panel displays the circulating tumor DNA fraction. The dashed lines at 0.02, 0.10, and 0.20 denote the cutoffs to reliably detect point mutations, loss of heterozygosity, and homozygous deletions, respectively. Bottom panel, heatmap of the mutational landscape detected from circulating tumor DNA profiling of 327 cell-free DNA samples from 217 individuals. For visualization purposes, only the 76 samples with a relevant alteration are shown here. Type of alteration is coded according to the bottom legend. Up to two mutations or structural variants (forward and backslashes) are displayed per patient. Triangles and boxes represent single nucleotide variants and indels, respectively. Subclonal mutations are defined as having an allele frequency <1/4 of the circulating tumor DNA fraction. The same definition was applied to structural variants after median allele frequency adjustment with respect to the mutations. The BRCA2 structural variant of patient P-00039325, sample 3167424, was classified as borderline subclonal although relevant in the progressing clone after chemohormonal treatment (Additional file 6: Figure S7C). Synonymous point mutations are not displayed here. Variants of unknown significance are non-synonymous single nucleotide variants outside hotspots, not annotated as pathogenic in variant databases. Structural variants of unknown significance are for example confined to a single intron, without affecting neighboring exons. X-axis: cell-free DNA samples sorted according to the number of alterations detected in each gene in alphabetical order. Patients with multiple samples are colored in blue. The asterisk indicates samples with microsatellite instability

