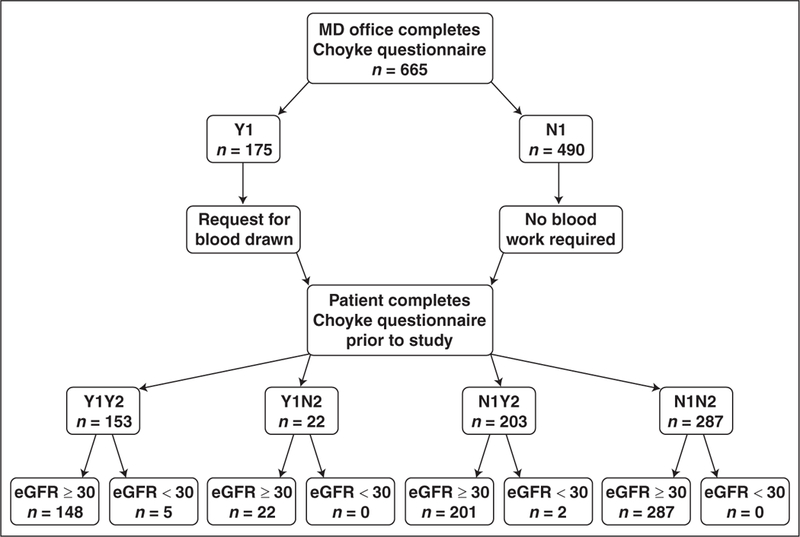
Fig. 1.

Flowchart of response results and corresponding estimated glomerular filtration rate (eGFR) values shows Yes (Y) and No (N) response results obtained at initial time point (Y1 or N1) and at second time point (Y2 or N2). Each box with response details number of patients in group and lowest level data correlates combined responses at both time points with eGFR results. All eGFR values were derived from serum creatinine measurements obtained within 30 days before MRI and are in units of mL/min/1.73 m2.
