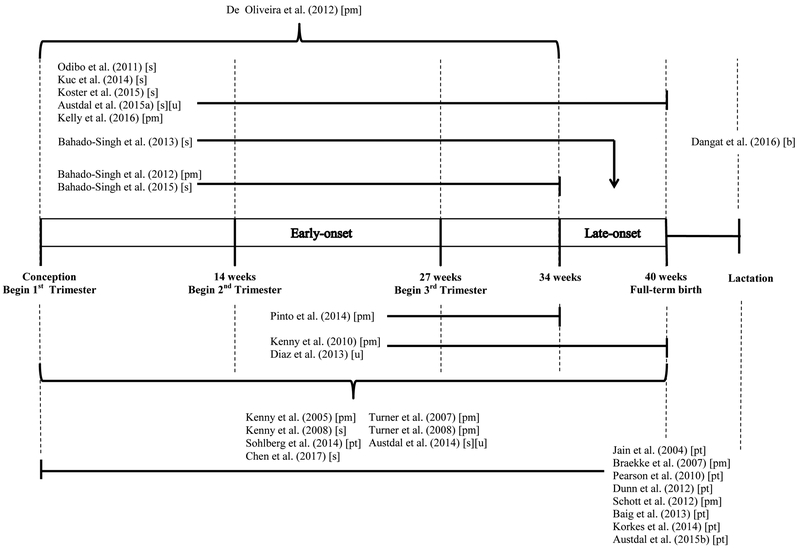
Figure 2: Graphic representation of sample collection relative to the timing of onset of the preeclampsia cases studied onset of interest.
Studies are listed by time of sample collection, with an arrow indicating the onset of interest. Studies that look at both EO and LO biomarkers are shown here as observing the duration of the pregnancy.
Biological specimen collected: [s] serum; [u] urine; pm [plasma]; pt [placental and intrauterine tissue]; b [breast milk]

