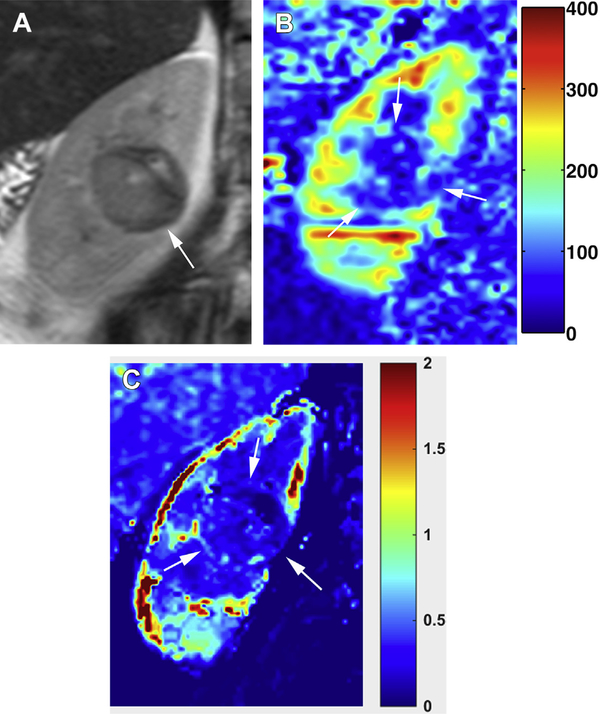
Fig. 3.
Papillary renal cell carcinoma (Fuhrman grade 3). (A) Coronal T2-weighted SSTSE image shows a hypointense renal mass (arrow) in the central, mid–right kidney. (B) ASL perfusion map shows low levels of perfusion in the mass (arrows). (C) Ktrans map generated from DCE acquisition demonstrate expected hypovascularity within the mass (arrows).

