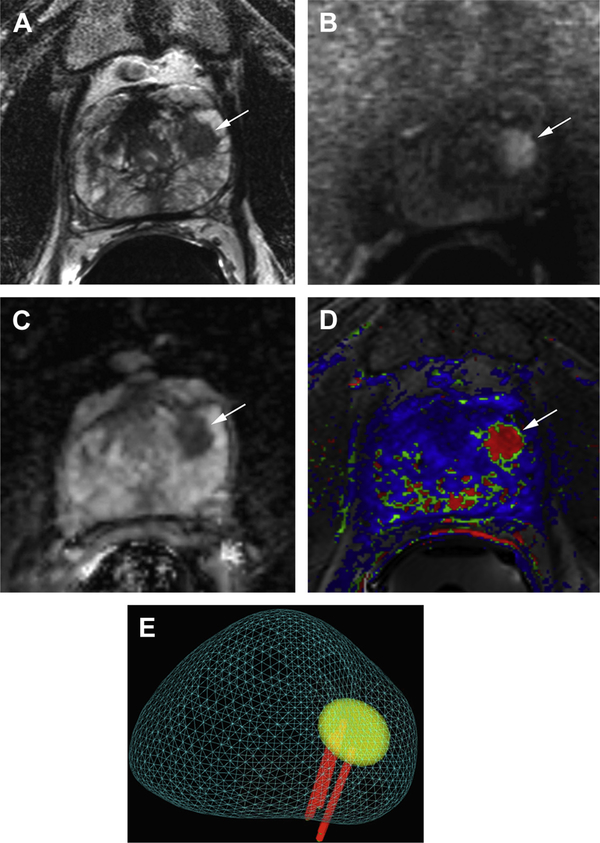
Fig. 6.
Prostate cancer diagnosed with mpMRI and targeted MR imaging–TRUS fusion biopsy. A 57-yearold man with elevated PSA (11 ng/mL) and 2 previous negative biopsies underwent MR imaging for biopsy planning. (A) Axial T2-weighted image shows a focal area of low signal intensity in the anterior left midgland (arrow). (B) The lesion shows restricted diffusion manifested by high signal intensity (arrow) on the DWI (b-value = 2000) and (C) low signal intensity (arrow) on the ADC map as well as rapid enhancement and washout on DCE, (D) illustrated by red color (arrow) on the kinetic map. (E) Targeted MR imaging–TRUS fusion biopsy revealed Gleason score 3 + 4 prostate cancer in 5 of 5 cores with up to 55% of core length involved by tumor.

