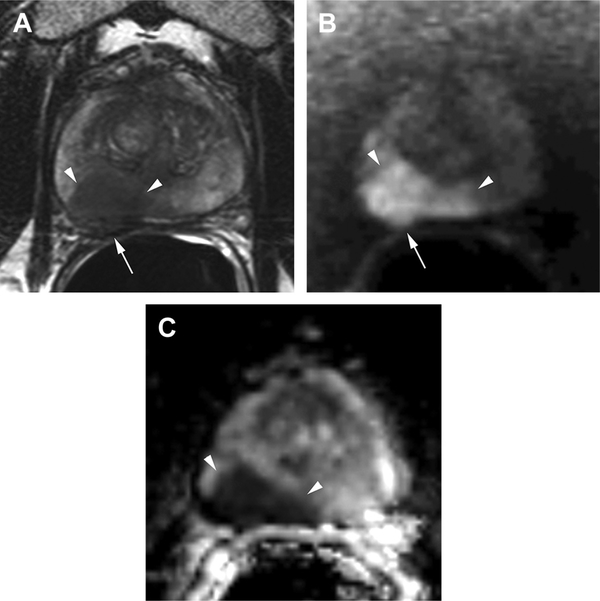
Fig. 7.
Inverse relationship between ADC values and Gleason score. A 64-year-old man with elevated PSA (36 ng/mL) and recently diagnosed prostate cancer underwent MR imaging for local staging. (A) Axial T2-weighted image shows a large, ill-defined mass predominantly involving the right midgland peripheral zone (arrowheads). (B) The mass exhibits marked increased signal intensity (arrowheads) on the diffusion image (b-value = 2000). Note the larger tumor extension demonstrated by DWI compared with the T2-weighted image. Posterior bulging of the prostate contour on both T2- and diffusion-weighted images (arrows in [A] and [B]) is consistent with extraprostatic extension. (C) The ADC map confirms marked restriction in the mass (arrowheads) with low ADC values (0.5 10−3 mm2/s), which increases the risk of high Gleason score (ie, aggressive tumor) in this patient. Biopsy confirmed the presence of clinically significant cancer with Gleason score 4 + 3 prostate cancer in 4 cores of the right midgland with up to 95% of core length involved by tumor.

