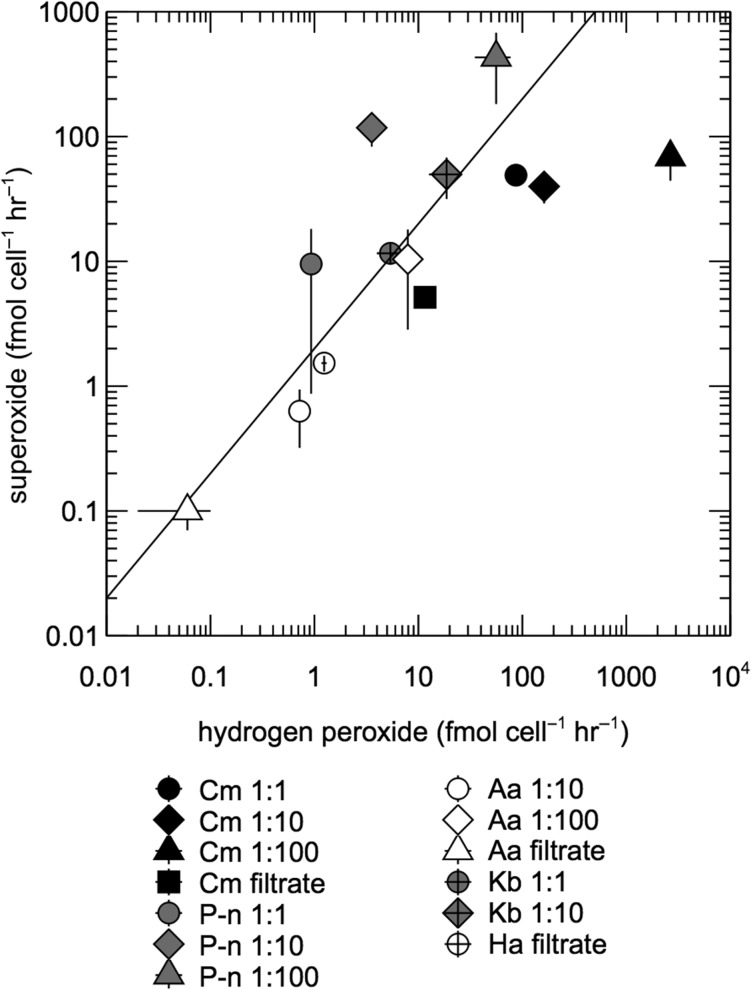
Fig. 3.
Comparison of superoxide and hydrogen peroxide production rates in diluted cell suspensions and cell-free filtrates. C. marina (Cm), Pseudo-nitzschia sp. (P-n), A. anophagefferens (Aa), K. brevis (Kb), and H. akashiwo (Ha). Error bars represent the standard error of the mean of biological replicates. The diagonal line represents the 2:1 molar ratio of superoxide to hydrogen peroxide production expected from the dismutation of superoxide.

