
Figure 2.
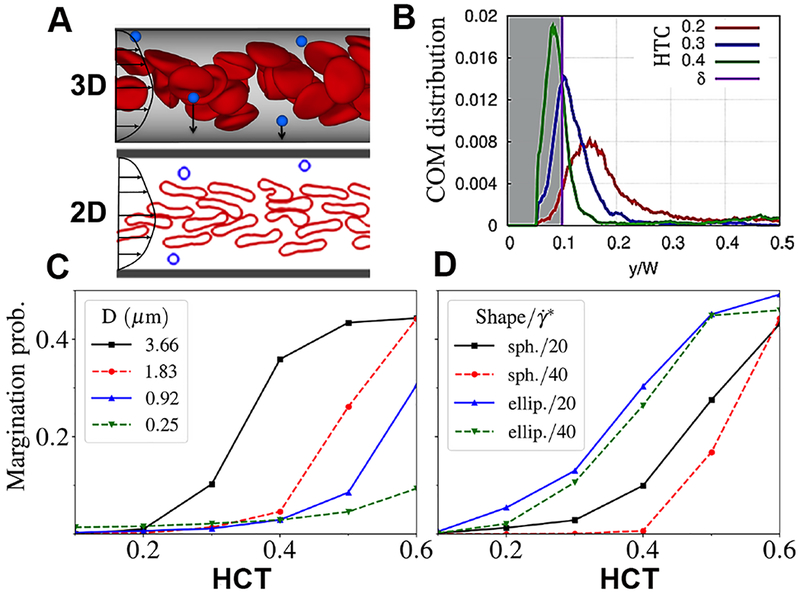
Computational results on particle margination trends; [A] Migration of RBCs in the pressure-driven flow toward the center of the vessel due to hydrodynamic lift force from the walls, leads to particle margination; 2D simulations reproduce qualitatively the margination trends in 3D; [B] Center-of-mass (COM) distribution of micro-particles in the vessel in blood flow with different hematocrits; [C] Margination probability of spherical particles of different sizes as a function of hematocrit (HCT) where margination probability is defined as the area under the COM distribution with a pre-defined distance δ away from the wall with δ = Dm + h, where Dm is the largest dimension of a particle, and h is the thickness of a layer which presents high probability of adhesion for particles in it (here, h = 100 nm); [D] Margination probability of micro-particles with spherical and ellipsoidal shapes for different shear rates as a function of HCT; Panels C and D show the 2D simulation results, indicating that microscale particles marginate more than nanoscale particles in presence of physiological HCT; furthermore, ellipsoidal microparticles possess a slightly higher margination probability compared to their spherical counterparts in presence of physiological HCT.