
Figure 3.
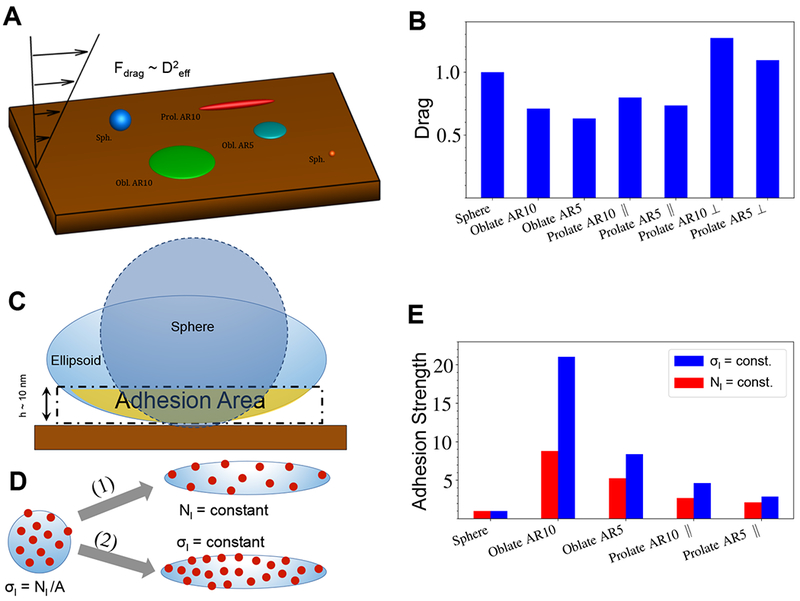
Adhesion of microparticles and nanoparticles; [A] Schematic of adhesion simulations where the drag force is proportional to the squared effective diameter (height) of the particle and this drag force is calculated for particles fixed at the wall; [B] Hydrodynamic drag force on particles with an equal volume normalized by the drag force on the spherical particle, showing that oblate ellipsoidal particles lying parallel to the surface will have the least extent of drag force on them; [C] Adhesion area is referred to the area on the particle (spherical or non- spherical) surface in a close distance of h ~ 10 nm from the wall where non-specific or specific interactions can prevail and adhesion strength is defined as the output of total ligand interactions within the adhesion area in a close distance h = 10 nm to the wall and is normalized by a value for the spherical particle; [D] Illustration of two different possibilities for ligand decoration on the DDS particle surface: (i) constant ligand density (σL=const) and (ii) constant total ligand number (NL=const) at the particle surface; for experimental studies reported the particle manufacture process kept NL constant; [E] Analytically calculated adhesion strength for different particle shapes shows that oblate shapes will have the highest strength of adhesion for both σL= constant and NL= constant scenarios.