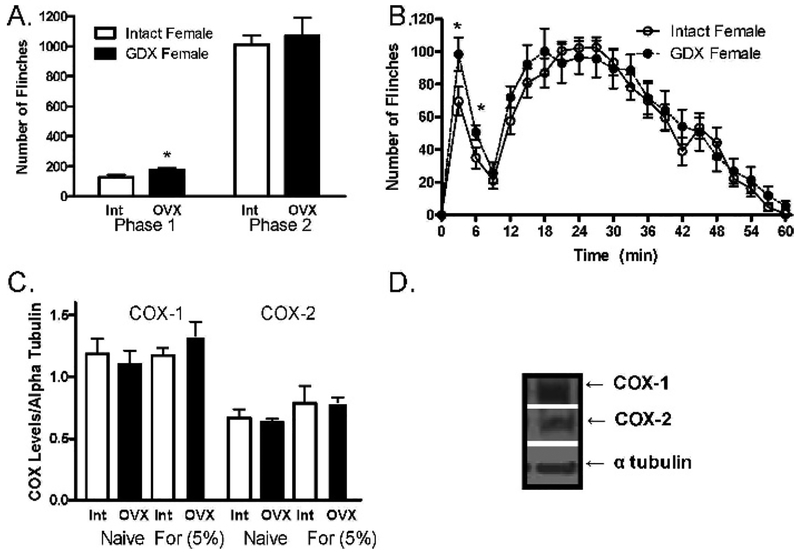
Fig 1.
(A) Total sum number of flinches (±SEM) across phase I (0–9 min) and phase II (10–60 min) in intact and OVX female rats after 5% formalin administration (n=8/group). (B) Formalin-induced responses across time (n=8/group). (C) COX1-COX2 protein levels in the spinal cord in intact and OVX female rats, basal and after 5% formalin administration (n=4/group). COX-1 and COX-2 protein levels are plotted as the ratio of protein levels over α-tubulin levels across treatment groups. (D)Typical immunoband. *Denotes significant difference to respective control (P<.05). [For: formalin; OVX: ovariectomized; Int: intact.]

