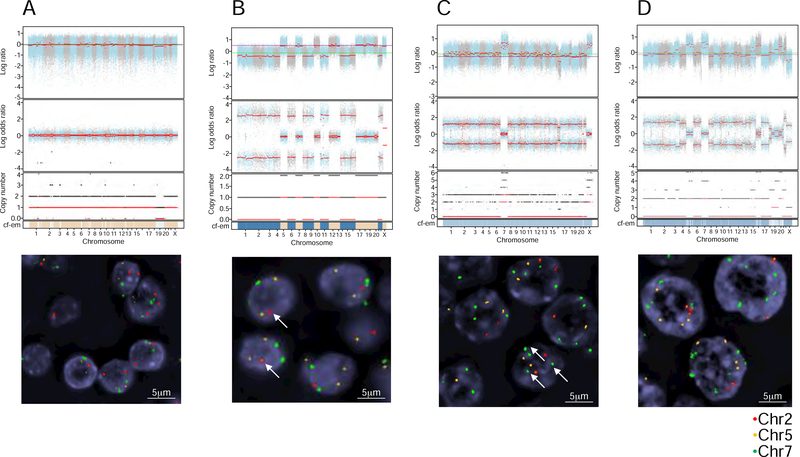
Figure 4. Example of cytogenic subtypes, characterized using genomic copy number analysis and FISH.
(A–C) FACETS plots show the GC-corrected normalized log ratio of tumor to normal read depths at a set of single-nucleotide polymorphism (SNP) loci; the log odds ratio was determined from cross-tabulating the tumor and normal reads into alleles for loci that are heterozygous in the germline; the total (black) and minor (red) integer copy number assignment for the segments is indicated; the final band shows the cellular fractions, where dark blue represents 1, lighter shades represent lower numbers, and beige represents no copy number change. FISH validation was performed for chromosomes 2, 5, and 7. These analyses are provided for 4 representative patients: HMIN 18 (A), HMIN 9 (B), HWIDE 17 (C), and HWIDE 16 (D). The arrows in HMIN 9(B) show 1 copy of chromosome 2 (haploid phenotype). The arrows in HWIDE 17(C) show multiple copies of chromosome 7 (WCD chromosome 7) See also Figure S5 and Table S3 and S5

