
Fig. 3.
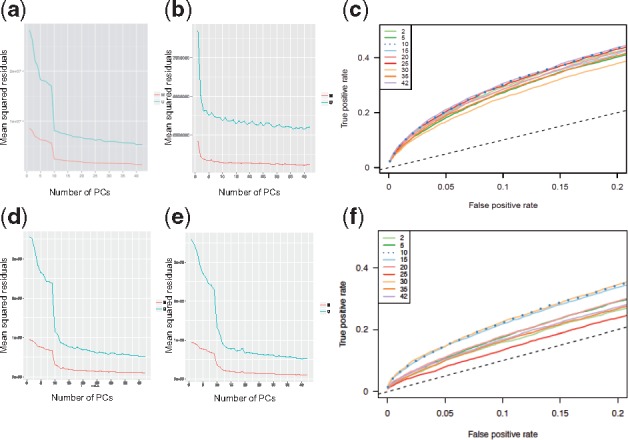
Parameter selection for FN. The main parameter for FN is the number of principal components of control variation with which to normalize probe quantiles. Screeplots (a, b, d, e) show the metric used to meffil for choosing the optimal number of principal components in ARIES (a, b, c) and GOYA (d, e, f), the amount of probe quantile variation unexplained by the principal components under 10-fold cross validation. The explained variation is mainly due to technical variance as the control probes should not be correlated with biological signal (Supplementary Material). Screeplots (a, d) show the variation without regressing out random effects whereas plots (b) and (e) show the variation after regressing out slide (b) or plate (e) as random effect. Plots (c) and (f) compares true and false positive rates in a downstream EWAS of pre-natal smoking in ARIES (c) and GOYA (f) after normalizing with different numbers of principal components and regressing out slide or plate as a random effect. TPRs were estimated by comparison to associations from a large meta-analysis (Joubert et al., 2016)