
Fig. 3.
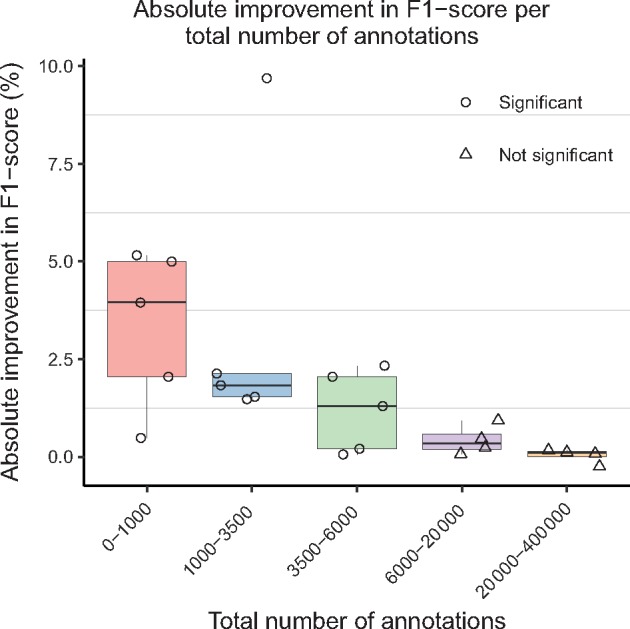
Box plots representing absolute F1-score improvement over the baseline after transfer learning, grouped by the total number of annotations in the target gold-standard corpora (GSCs). Bin boundaries were generated using the R package binr (Izrailev, 2015). Scores for individual GSCs are plotted, where point shapes indicate statistical significance ()