
Fig. 1.
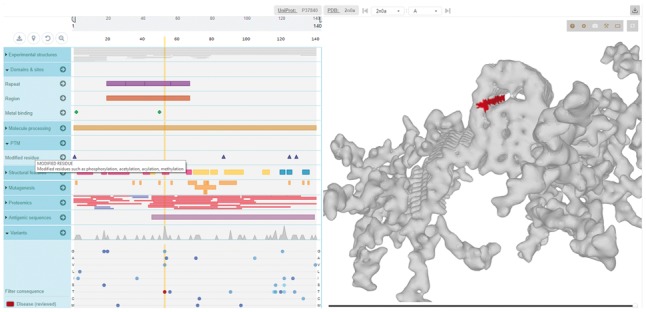
MolArt displays in the left panel the molecule’s sequence, relevant annotations (including variation data) and list of available structures (either experimental or predicted) for given molecule. The right panel shows selected 3D structure over which any of the sequence annotations can be color-overlaid. The above example displays Alpha-synuclein (UniProt ID P37840), a protein which accumulates in the brain cells of Parkinson's disease patients. One of the corresponding structures in PDB (ID 2n0a) shows the fibril structures of the protein. We can overlay the individual disease-related mutations to see that the mutations happen at positions which ensure stability of the structure and their disruption thus lead with high probability to adverse effects