
Figure 1.
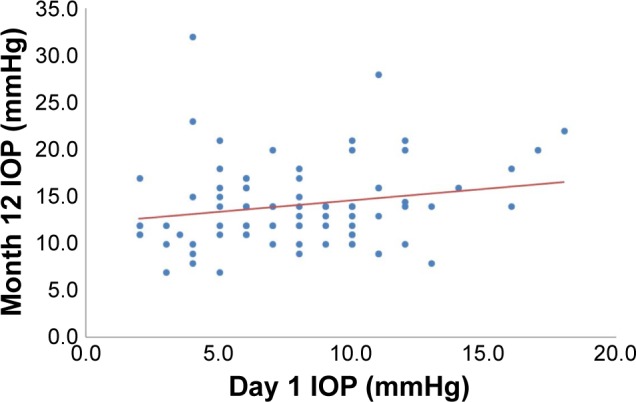
Scatter plot of Day 1 and Month 12 IOP for all Xen surgeries followed up to 12 months (n=83).
Note: Univariate linear regression analysis: r2=0.1580, P<0.0001.
Abbreviation: IOP, intraocular pressure.
Official websites use .gov
A
.gov website belongs to an official
government organization in the United States.
Secure .gov websites use HTTPS
A lock (
) or https:// means you've safely
connected to the .gov website. Share sensitive
information only on official, secure websites.
Scatter plot of Day 1 and Month 12 IOP for all Xen surgeries followed up to 12 months (n=83).
Note: Univariate linear regression analysis: r2=0.1580, P<0.0001.
Abbreviation: IOP, intraocular pressure.