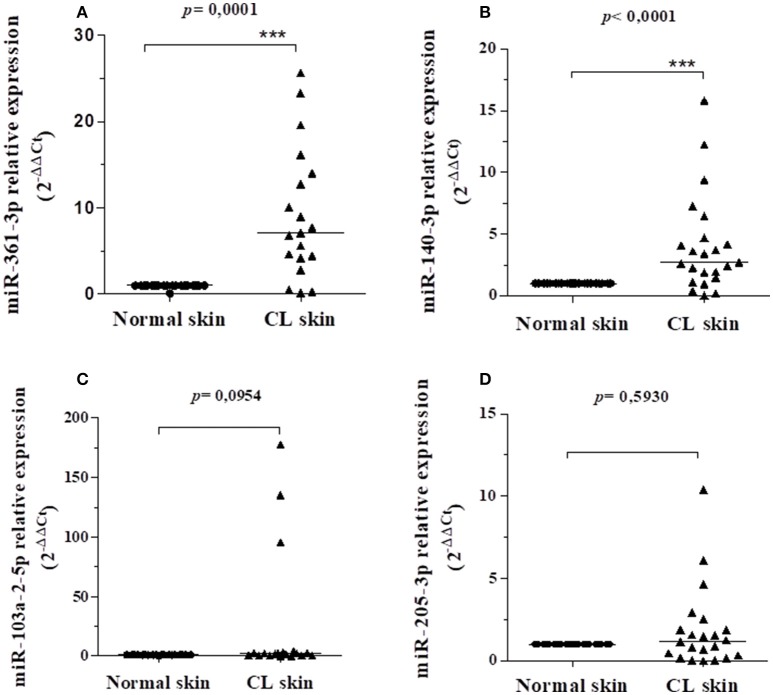
Figure 1.
Relative gene expression of miR-361-3p (A), miR-140-3p (B), miR-103a-2-5p (C), and miR-205-3p (D) between CL skin and normal skin samples from the same patient. All values were represented by the equation 2-ΔΔCt of the lesion in relation to the normal skin of each individual. The bars represent the median of the groups. Data were analyzed using the non-parametric Mann–Whitney test as implemented by the GraphPad Prism program. The miR-361-3p and miR-140-3p were significantly more expressed in LC lesions compared to normal skin samples (p = 0.0001 and p < 0.0001, respectively).

