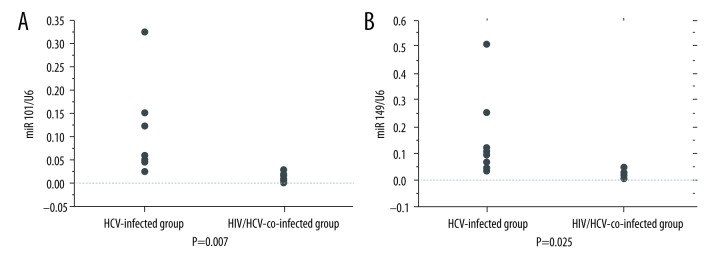
Figure 2.
(A) Data are presented as mean ± standard deviation (SD). The expression of miR-101 was significantly decreased in the HIV/HCV-co-infected group (n=10) as compared to that in the HCV-infected group (n=10) (0.103±0.09 vs. 0.0157±0.0093, p=0.007, Student’s t test.). (B) Data are presented as mean ±SD. The expression of miR-149 decreased significantly in the HIV/HCV-co-infected group (n=10) as compared to that in the HCV-infected group (n=10) (0.152±0.159 vs. 0.0192±0.015, p=0.025, Student’s t test).

