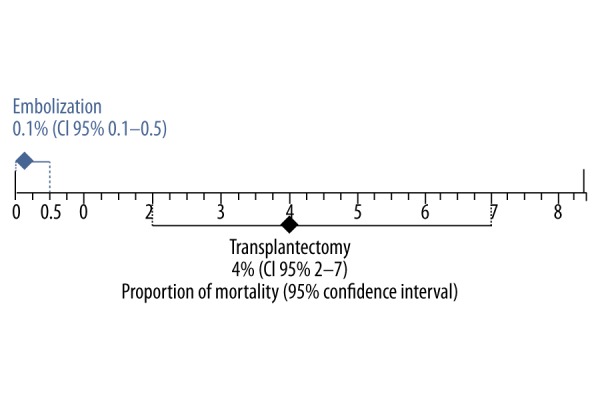
Figure 3.

Combined mortality rate with 95% confidence interval of studies of non-functioning renal grafts in the transplantectomy and embolization groups. There are significant differences between groups due to no overlap of the 95% confidence intervals.
