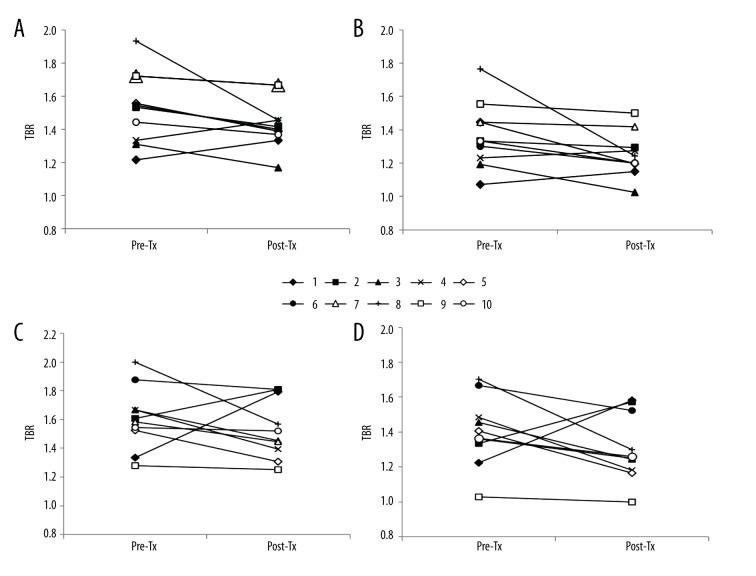
Figure 2.
Changes in TBR values of right and left WH in individual participants after renal transplantation. (A) WH-TBRmax of right carotid artery. (B)WH-TBRmean of right carotid artery. (C) WH-TBRmax of left carotid artery. (D) WH-TBRmean of left carotid artery. Pre-Tx – before renal transplantation; Post-Tx – after renal transplantation; TBR – target-to-background ratio.

