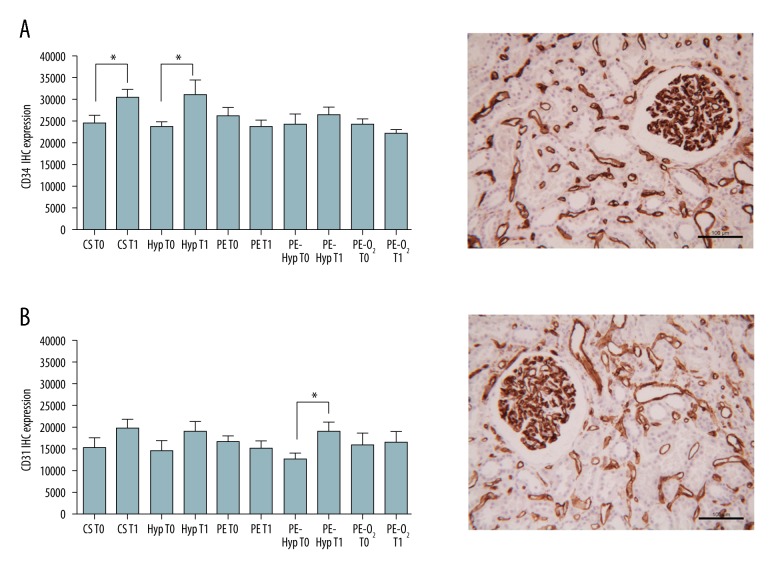
Figure 1.
Representative immunohistochemical images (right column) and semi-quantitative analysis (left column) of kidney tissue expressing CD34 (A) and CD31 (B) endothelial cell markers. T0 and T1 values are reported separately. (A, B) Scale bars=100 μm. (A) * p-value=0.0187 for CS group, * p-value=0.0466 for Hyp. (B) *p-value=0.0109 for Hyp-PE group; unpaired Student’s t-test.

