Figure 3.

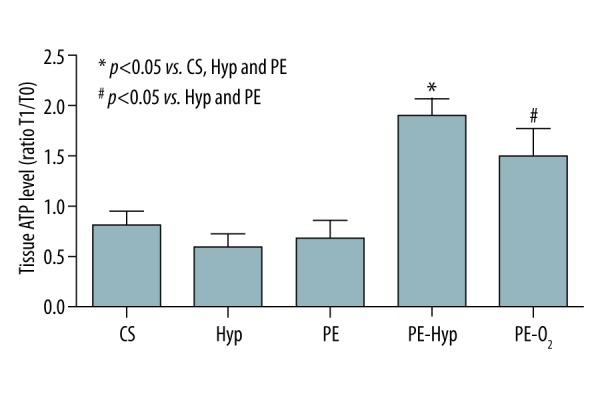
Tissue adenosine triphosphate (ATP) level. Results are expressed as the ratio between ATP content at T1 and T0. The results of post-hoc analysis are indicated by asterisk.

Tissue adenosine triphosphate (ATP) level. Results are expressed as the ratio between ATP content at T1 and T0. The results of post-hoc analysis are indicated by asterisk.