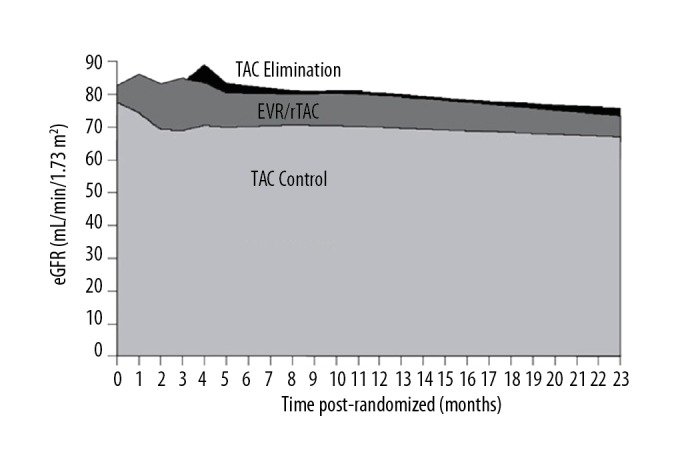
Figure 2.

Area under the curve (AUC) of estimated GFR (eGFR) from baseline to month 24 according to treatment group (ITT population). EVR – everolimus; rTAC – reduced tacrolimus; TAC – tacrolimus.

Area under the curve (AUC) of estimated GFR (eGFR) from baseline to month 24 according to treatment group (ITT population). EVR – everolimus; rTAC – reduced tacrolimus; TAC – tacrolimus.