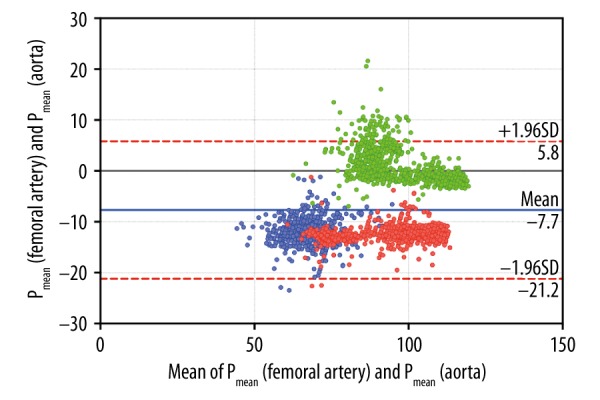
Figure 2.

Bland-Altman plots (difference vs. average) of pressure measurements in the femoral artery (pulse curve analysis) and aorta (telemetry) from animals #1–3. Overall bias was 7.7 mmHg (±6.9 mmHg, 95% limits of agreement −5.8 and 21.2 mmHg). Data subsets of the animals are color-coded: animal #1: blue, animal #2: red, animal #3: green.
