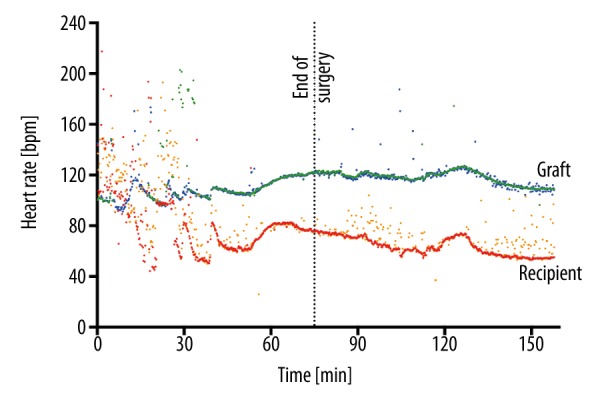
Figure 5.

Heart rates (HR) from animal #1 in the late perioperative period. The graft’s HR (upper line) was calculated from the left ventricular (LV) pressure probe (blue), and from pericardial ECG (green). The recipient’s own HR (lower line) was calculated from the femoral arterial line (orange) and from the proximal aorta via telemetric pressure probe (red). HRs of both organs were distinctly different.
