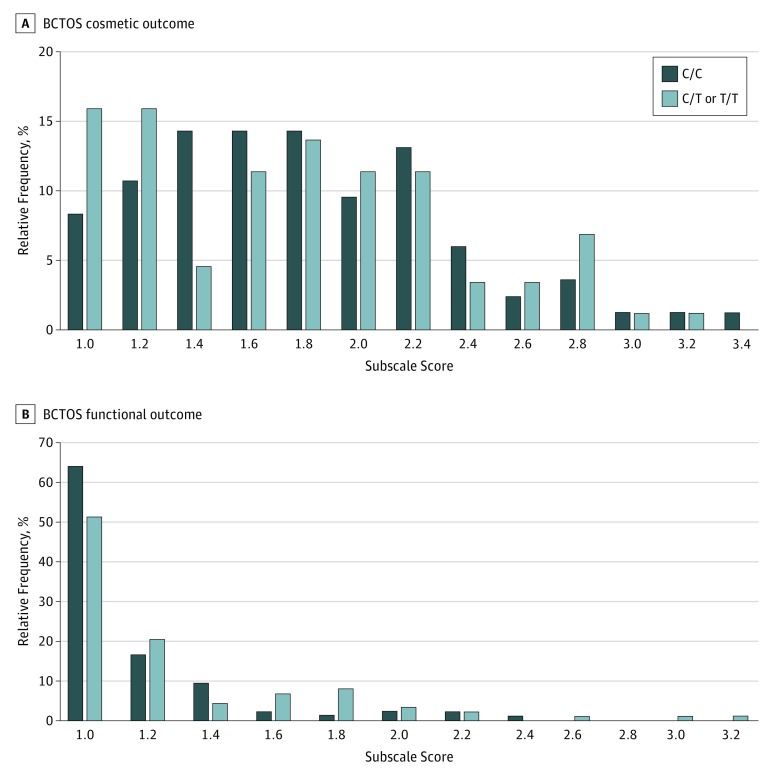
Figure 2. Frequency of Breast Cancer Treatment Outcomes Scale (BCTOS) Subscale Scores Among Patients With Genotypes C/C vs C/T or T/T at Position −509 of the TGFB1 Gene.
Each subscale score is the mean of the ratings of all items belonging to that subscale. Each item evaluates the difference between the treated and untreated breast on a 4-point ordinal scale: 1, indicates no difference; 2, slight difference; 3, moderate difference; 4, large difference. Scores are assorted into 0.2-U bins.

