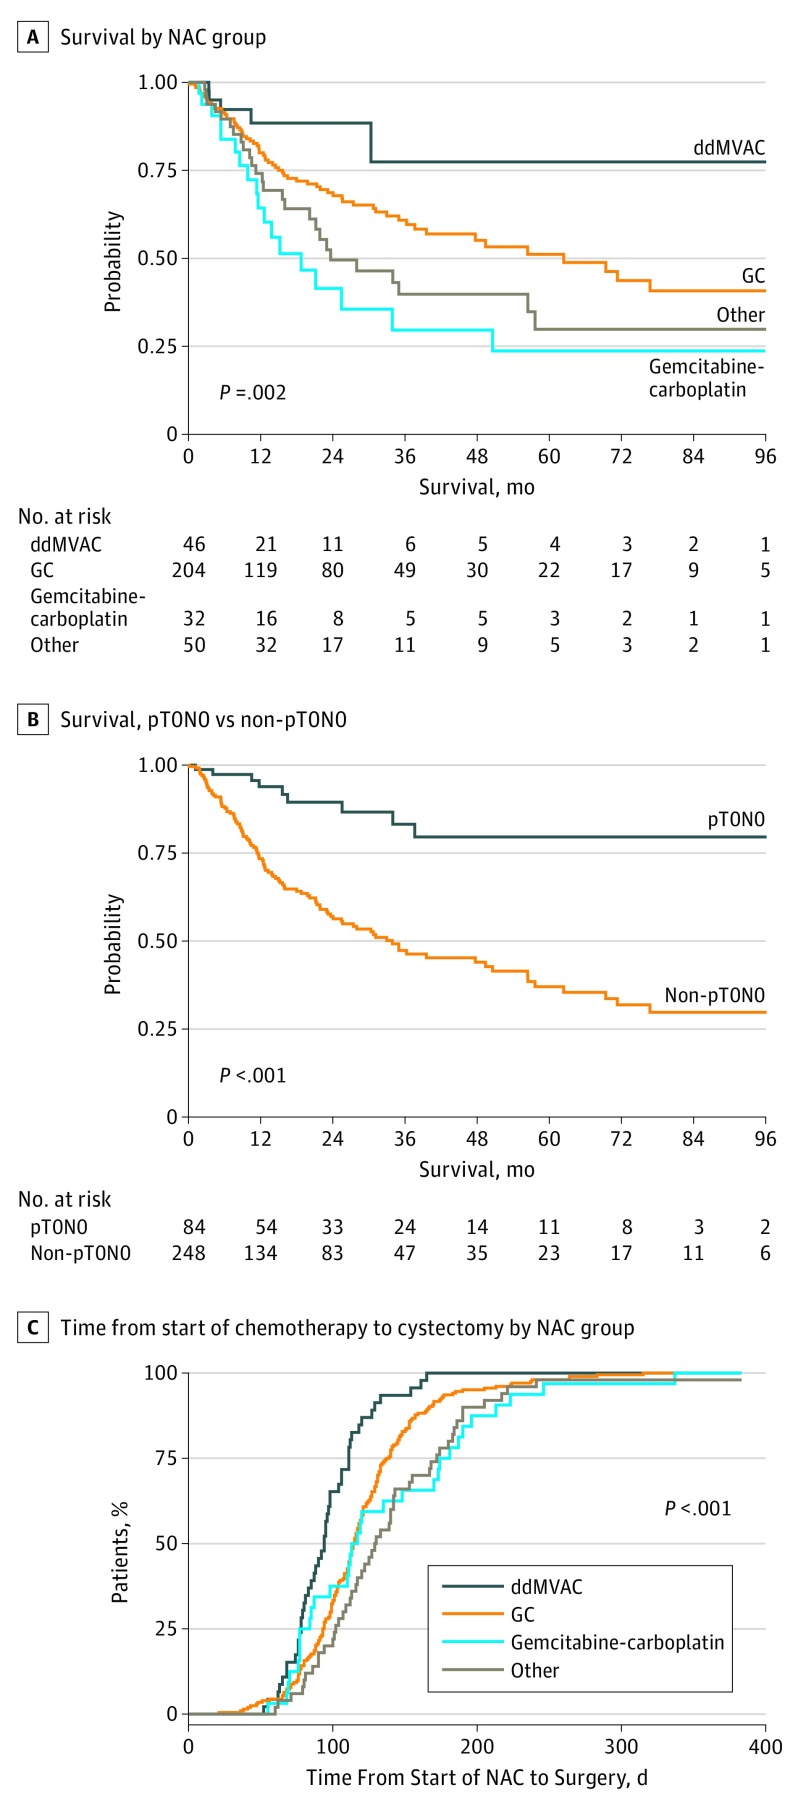
Figure 3. Survival Analyses.
A, Kaplan-Meier curves for overall survival stratified by neoadjuvant chemotherapy group. B, Kaplan-Meier curves for overall survival for patients with complete response (pT0N0) vs those without complete responses (non-pT0N0). C, Days from start of neoadjuvant chemotherapy to radical cystectomy by neoadjuvant chemotherapy group. ddMVAC indicates dose-dense methotrexate, vinblastine, doxorubicin, and cisplatin; GC, gemcitabine-cisplatin; and NAC, neoadjuvant chemotherapy.

